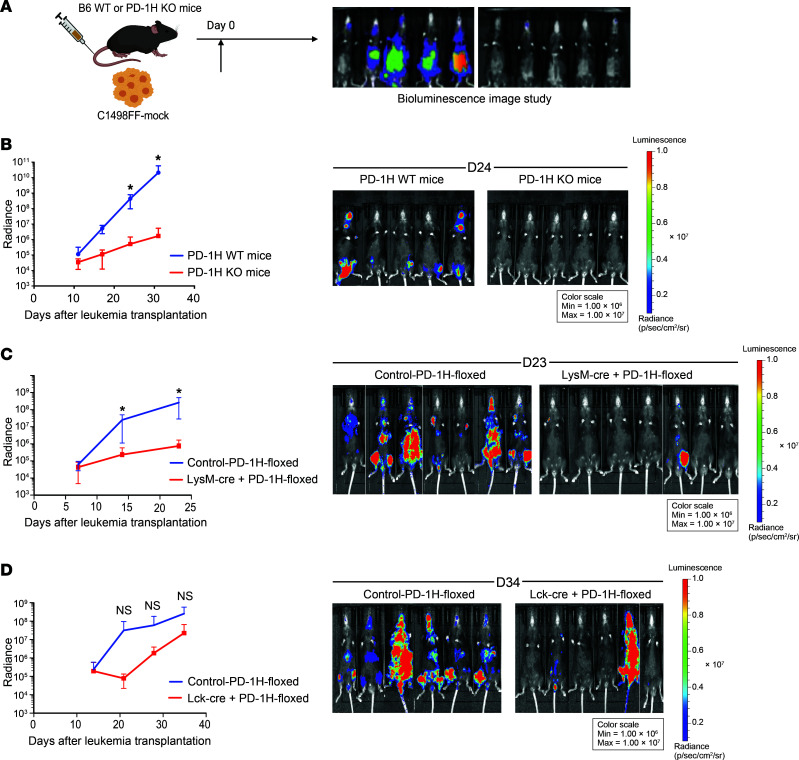
Figure 3. Host-derived PD-1H induces immune evasion in AML.
(A) Syngeneic mouse leukemia model using tail-vein injection with myeloid leukemia cells (C1498). Mouse leukemia cells (C1498FF-mock) were transplanted into B6 PD-1H WT or PD-1H–KO mice or lineage-specific PD-1H–KO mice. In vivo proliferation was assessed by bioluminescence. (B) In vivo antileukemia effect of genetic deletion of PD-1H in host mice. Radiance indicates the mean value per group, and error bars represent SEM. P value determined by Student’s t test at each time point. n = 5 per group; *P < 0.05. These experiments were repeated 3 times. Repeated measures were determined by ANOVA with 2 factors (P > 0.05, no difference among experiments). (C) In vivo antileukemia effect of myeloid lineage–specific deletion of PD-1H in host mice. Bioluminescence was compared in LysM-Cre+PD-1H-floxed mice with control–PD-1H-floxed mice. Radiance indicates the mean value per group, and error bars represent SEM. P value determined by Student’s t test at each time point. *P < 0.05. n = 9 per group. Representative data from 2 independent experiments were combined. Repeated measures were determined by ANOVA (P > 0.05, no difference among experiments). (D) In vivo antileukemia effect of T cell lineage–specific deletion of PD-1H in host mice. Bioluminescence was compared in Lck-Cre+PD-1H-floxed mice versus control–PD-1H-floxed mice. Radiance indicates the mean value per group, and error bars represent SEM. P value determined by Student’s t test at each time point. Error bars represent SEM. n = 6 per group. Repeated measures were determined by ANOVA (P > 0.05, no difference among experiments).

