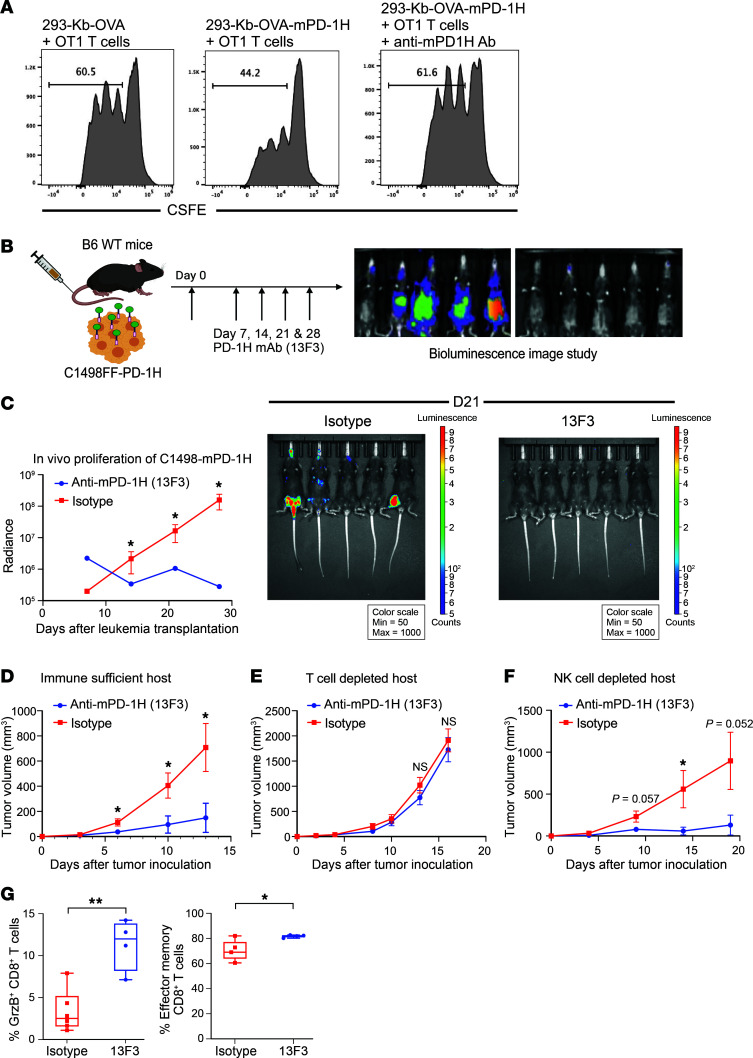
Figure 4. Anti-mouse PD-1H mAb reverses immune evasion induced by mouse AML surface PD-1H.
(A) PD-1H suppressed T cell activation. Inhibition of OT-1 T cells by mouse PD-1H on 293-KbOVA cells. T cell proliferation was assessed by CFSE dilution. The diluted population was assessed by the percentage of total T cells. (B and C) B6 PD-1H–KO mice were transplanted with myeloid leukemia cells expressing full-length PD-1H (C1498FF–PD-1H FL) and treated with anti–mPD-1H mAb (13F3) (B). Mice were assessed for in vivo leukemia proliferation using bioluminescence (C). A total of 200 μg of 13F3 or isotype control mAb was i.p. injected every 4 days from day 1 of transplantation of C1498FF–PD-1H cells (total 4 doses). Radiance indicates the mean value per group, and error bars represent SEM. P value determined by Student’s t test at each time point. n = 5. *P < 0.05. (D–F) In vivo growth of C1498FF–PD-1H s.c. tumor in B6 WT mice following anti–mPD-1H mAb treatment. A total of 200 μg of 13F3 or isotype control mAb was i.p. injected every 4 days from day 0 after s.c. injection of C1498FF–PD-1H cells (total 3 doses). (D) Tumor size was significantly smaller in the 13F3 treatment group compared with the isotype treatment group. Mean tumor volume ± SEM. Error bars represent SEM. n = 6 per group. *P < 0.05. (E and F) C1498FF–PD-1H s.c. tumor growth with 13F3 or isotype mAb treatment in B6 WT mice depleted of T cells or NK cells. n = 6. *P <0.05; ***P <0.01. P value determined by Student’s t test at each time point. (G) Immune cell subsets infiltrated in C1498FF–PD-1H tumors were assessed using mass cytometry. Left: percentages of granzyme B+ CD8+ T cells in total CD8+ T cells. Right: percentages of effector memory phenotype (CD44+CD62L–) CD8+ T cells in total CD8+ T cells. P value determined by Student’s t test. Error bars represent SEM. *P <0.05; **P <0.01.

