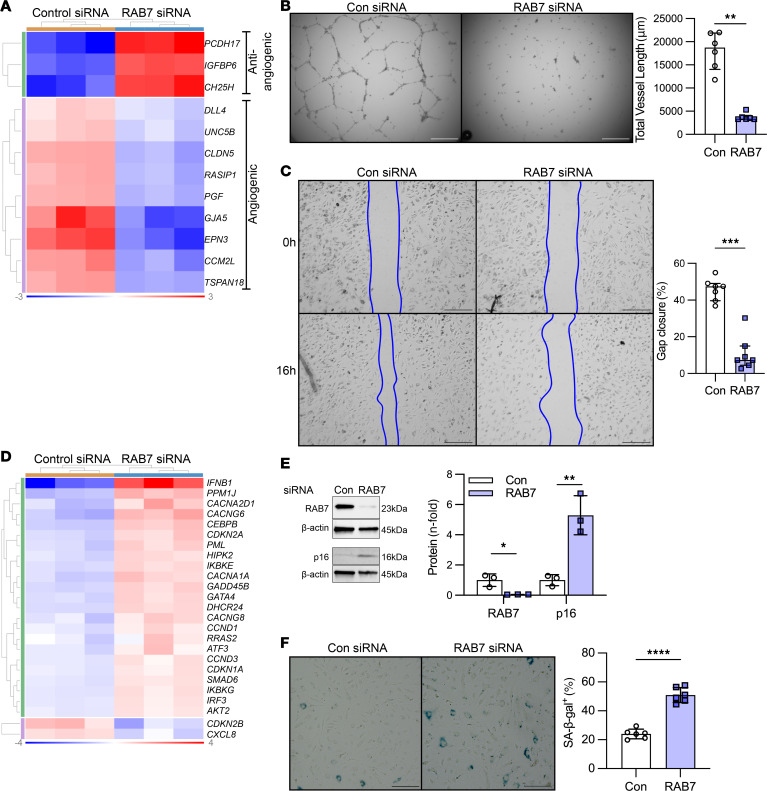
Figure 4. Loss of RAB7 induces endothelial dysfunction and senescence in PAECs.
(A) The clustered heatmap shows increased expression of antiangiogenic genes and reduced expression of angiogenic and EC barrier function genes in RNA-Seq of PAECs after RAB7 siRNA treatment versus treatment with control siRNA. n = 3 per group. (B) Representative phase-contrast images after 24 hours and quantification of total network length in RAB7 siRNA–treated PAECs. n = 6 per group. (C) Representative phase-contrast images after 16 hours of a gap closure assay and quantification of the percentage of gap closure in RAB7 siRNA–transfected PAECs versus treatment with control siRNA. n = 7 per group. (D) Clustered heatmap of DEGs of senescence-associated gene expression pattern (Ingenuity Pathway Analysis) in RNA-Seq of PAECs treated with RAB7 siRNA. n = 3 per group. (E) Representative immunoblots and densitometric quantification for RAB7 and p16 in PAECs treated with RAB7 siRNA. n = 3 per group. (F) Representative images and quantification of the fraction of SA–β-gal+ PAECs after RAB7 siRNA treatment versus treatment with control siRNA. n = 6 per group. Data are shown as single values and the median ± IQR (B and C) or the mean ± SD (E and F). *P < 0.05, **P < 0.01, ***P < 0.001, ****P < 0.0001, by 2-tailed Mann-Whitney U test (B and C) or 2-tailed Student’s t test (E and F). Heatmap data are normalized log2 fold expression. Data in B, C, E, and F are representative of 2 or more experiments. Scale bars: 250 μm (B and C) and 200 μm (F).

