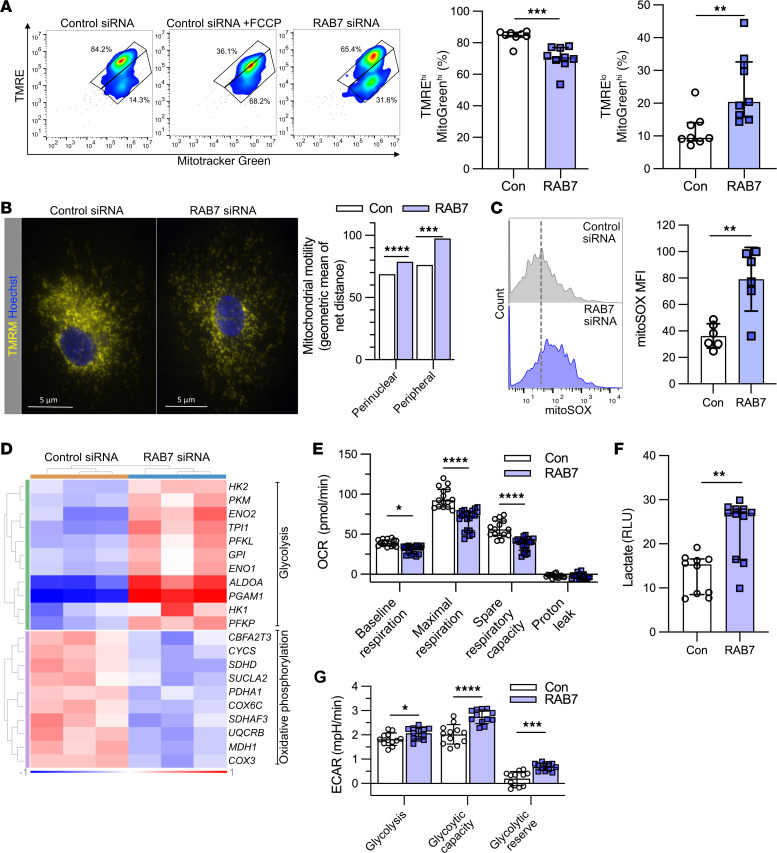
Figure 6. RAB7 silencing impairs mitochondrial membrane potential and mitochondrial function.
(A) RAB7 siRNA impaired ΔΨm as assessed by TMRE and MitoTracker Green (MitoGreen) flow cytometry. Carbonyl cyanide FCCP was used as a positive control (depolarizes mitochondrial membrane). TMREhi MitoGreenhi cells indicate cells with functional mitochondria, whereas TMRElo MitoGreenhi cells are cells with dysfunctional mitochondria. n = 8 (control) and n = 9 (RAB7). (B) Representative TMRM-stained images show overall reduction and perinuclear accumulation of functional mitochondria in RAB7 siRNA–treated PAECs. Results are representative of 3 experiments. Scale bars: 5 μm. RAB7 knockdown increased mitochondrial motility in peripheral and perinuclear regions. (C) RAB7 knockdown promoted mitochondrial ROS production as indicated by flow cytometry for mitoSOX. n = 6 per group for the representative histogram plots and quantification of MFI. (D) Clustered heatmap shows upregulated glycolysis-related DEGs and downregulated oxidative phosphorylation–related DEGs in bulk RNA-Seq from PAECs plus RAB7 siRNA. Expression is normalized log2-fold. (E) Seahorse high-resolution respirometrics show a reduced OCR with RAB7 siRNA at basal respiration, maximal respiration, and spare respiratory capacity. n = 15 (control) and n = 21 (RAB7). (F) Luminescence assay for lactate: increased lactate production in RAB7 siRNA–treated PAECs. n = 10 (control) and n = 11 (RAB7). (G) ECAR data reveal more rapid acidification (i.e., greater reliance on glycolysis) in the RAB7 siRNA–treated PAECs as shown for glycolysis and the basal and maximum glycolytic rates. n = 12 per group. All graphs show single values and the median ± interquartile range (A, E, and F) or the mean ± SD (C and G) (except B, as bar graphs in B indicate the geometric mean of a log-normal distribution). Data in A–C, E, F, and G are from 2 or more experiments. *P < 0.05, **P < 0.01, ***P < 0.001, and ****P < 0.0001, by 2-tailed Mann-Whitney U test (A and F), 2-tailed Student’s t test (C), and 2-way ANOVA (E and G) with Holm-Šidák post hoc test and normality testing of residuals (D’Agostino-Pearson).

