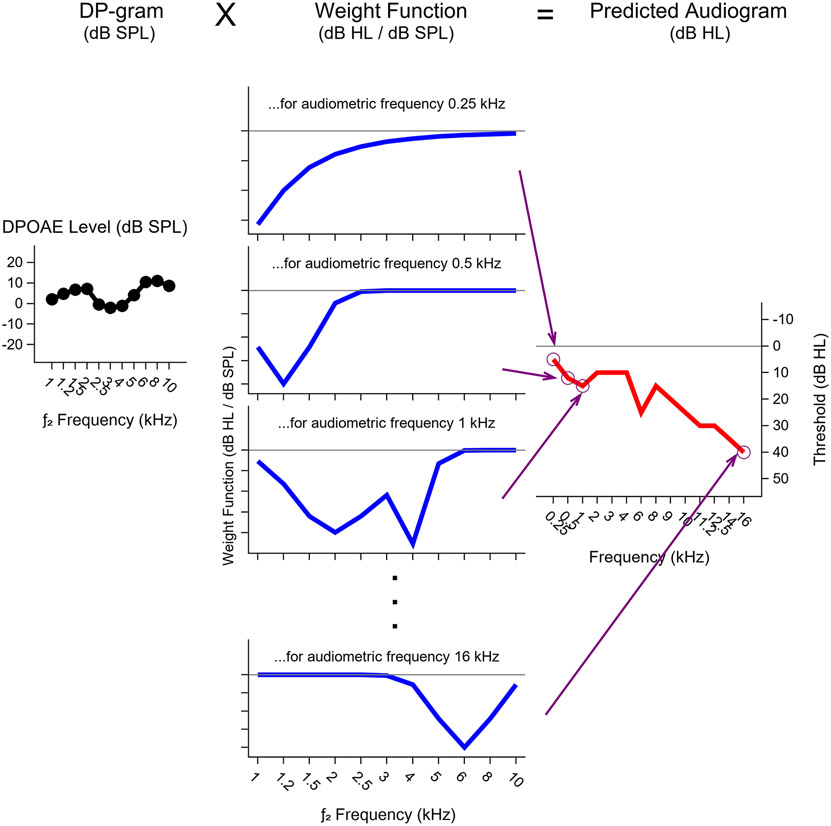
Figure 1. Schematic illustrating how pure tone threshold predictions are generated from DP-grams.
The DP-gram (shown in black in the left panel) is multiplied by the weight function for each audiometric frequency (fPTT, blue lines in the middle panel) to predict the pure tone threshold at that fPTT (follow arrows to circles on the red line in the right panel). DPOAE levels were measured in dB SPL, while pure tone thresholds were measured in dB HL, therefore the weight functions are expressed in dB HL/dB SPL to convert the DP-gram to a predicted audiogram. Note that this figure is solely for illustrative purposes and is not based on actual numerical data.

