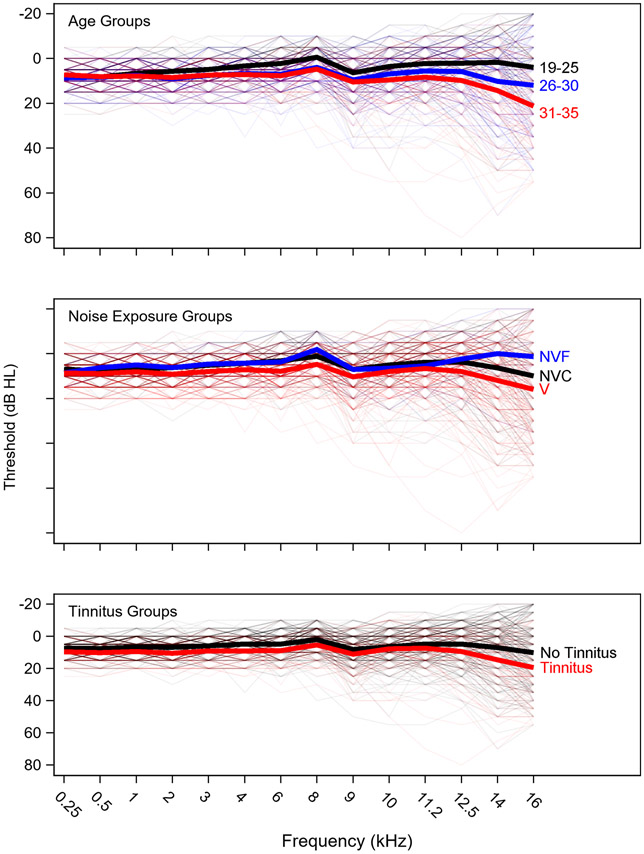
Figure 2. Audiometric thresholds by group.
Audiograms are plotted by age, noise exposure, or tinnitus group. Groups are color-coded and mean data is shown with a thick line. Thin lines indicate data for individual ears. Note that the same ears are plotted in each subplot, but grouped differently. NVF = Non-Veteran Firearms, NVC = Non-Veteran Controls, V = Veterans

