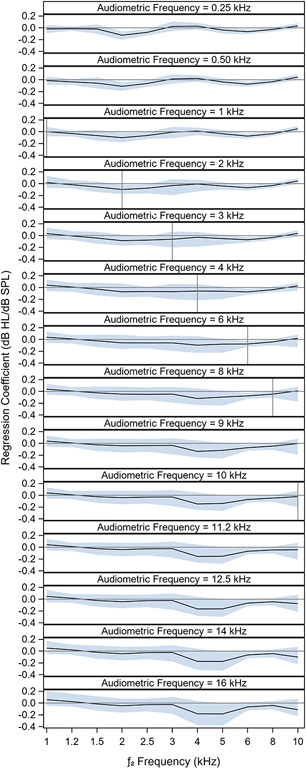
Figure 4. DPOAE weight functions.
DPOAE levels for the f2 frequency (fDPOAE) corresponding to the frequency of the predicted audiometric threshold (fPTT) do not have the biggest regression coefficients (weights). Regression coefficients are plotted for each combination of fPTT and fDPOAE. This indicates the relative weight that the DPOAE level at the indicated fDPOAE contributes to the predicted audiometric threshold at fPTT. The black line shows the median of the posterior distribution and the blue shaded region indicates the 90% confidence interval. Vertical gray lines show instances where fDPOAE corresponds to fPTT.

