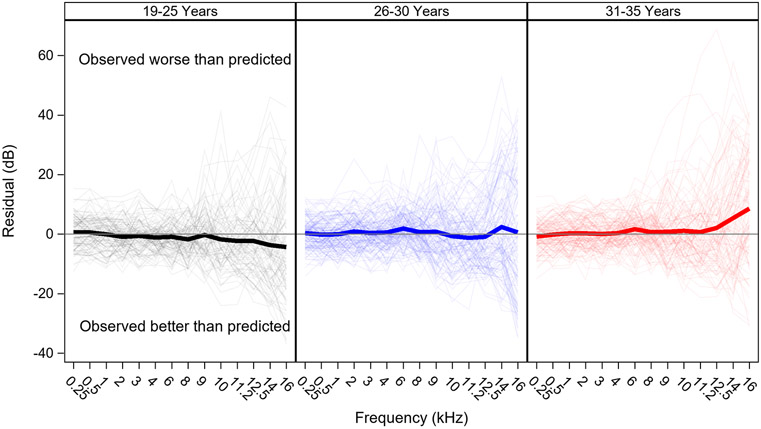
Figure 7. Residuals by age group.
Pure tone thresholds are poorer (bigger) than predicted among the oldest age group, but better than predicted among the youngest age group. Residuals (observed thresholds minus predicted thresholds) are plotted for each fPTT by age group. Thick lines show mean residuals, thin lines show residuals for individual ears. Actual values for the group mean residuals by frequency are shown in Table 4.

