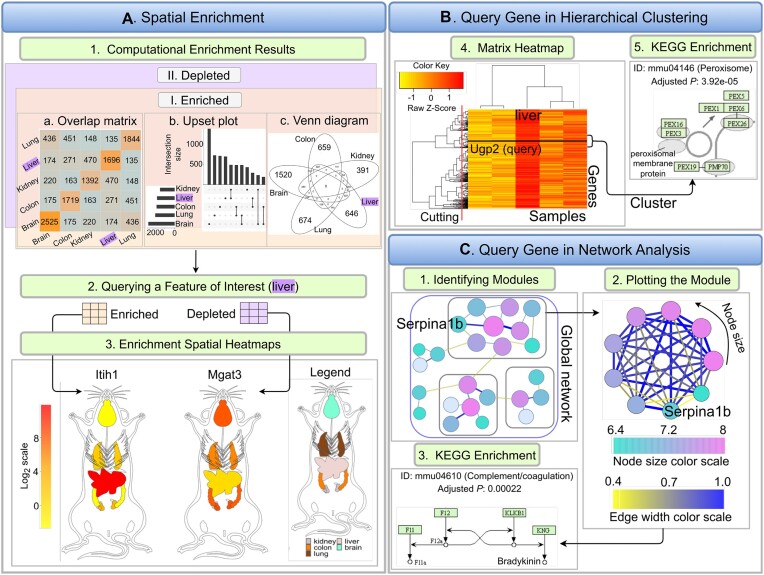
Figure 4.
Extensions for large-scale data. (A) Five spatial features are chosen as examples (brain, lung, liver, colon, kidney) for spatial enrichment analysis. Spatially enriched or depleted genes in each spatial feature relative to three other features are detected, while allowing one outlier. Intersects among biomolecule sets can be plotted as intersect heatmaps, UpSet plots or Venn diagrams (A1). Liver is used as query feature, and the corresponding enriched and depleted genes are returned in separate tables (A2). Next, one enriched (Itih1) and one depleted gene (Mgat3) are chosen for plotting enrichment SHMs (A3). (B) Hierarchical clustering is performed to detect genes with similar expression profiles and the results are presented in a matrix heatmap where Ugp2, another liver-specific gene, is highlighted by a horizontal line (B1). KEGG enrichment reveals that this cluster is enriched in genes involved in the Peroxisome pathway (B2). (C) A global network is constructed and partitioned to generate separate gene modules (C1–C2). The module containing the query gene Serpina1b is retrieved and plotted. Nodes and edges in the graph represent genes and adjacencies, respectively.

