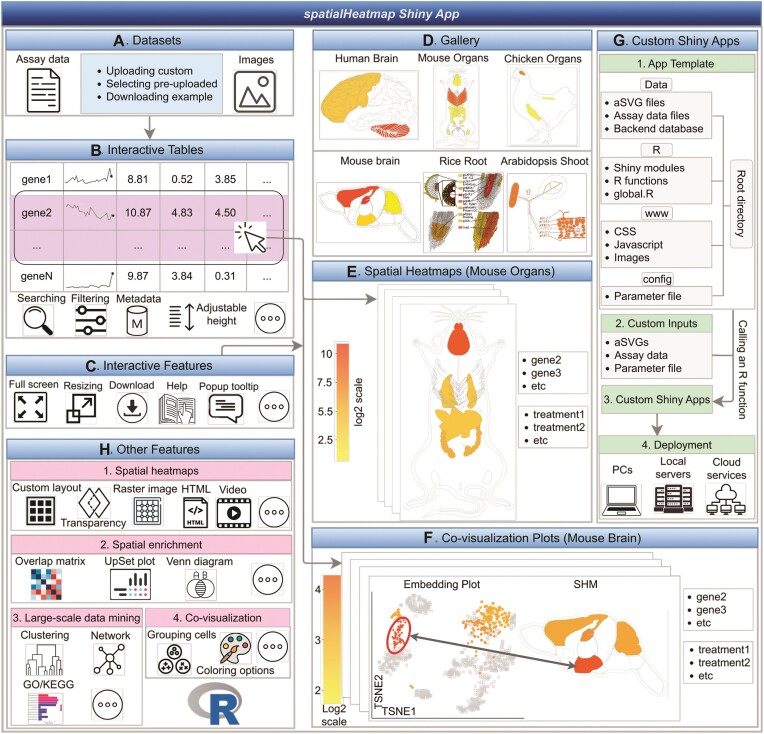
Figure 6.
Schematic summary of the spatialHeatmap Shiny App. (A) The input datasets can be selected from pre-configured examples or uploaded by the user. (B) The assay data are presented in interactive tables, that can be searched and filtered. (C) Visual representation of interactive features. (D) The landing page showcases a gallery of SHMs that can be created within a deployed web instance. (E, F) Examples of SHM and single-cell co-visualization plots that can be created by simple click actions in the interactive table. (G, H) Overview of additional features.

