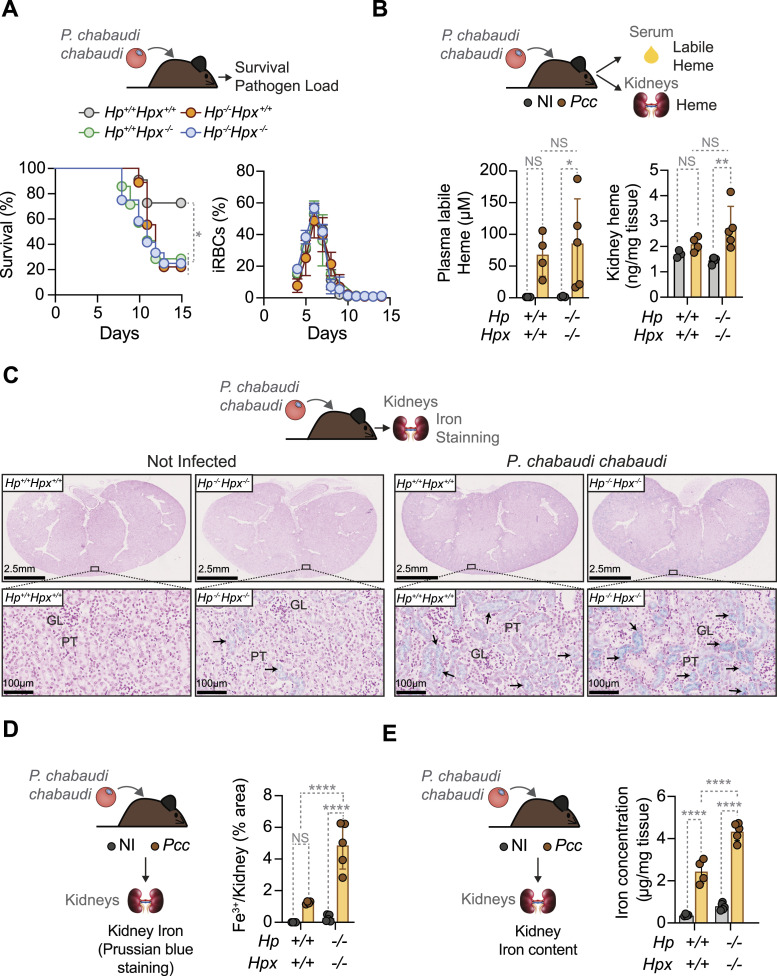
Figure 6. HP and HPX are essential to survive malaria in ageing mice.
(A) Ageing (>30 wk) mice from the indicated genotypes were infected with Pcc (i.p., 2 × 10⁶ iRBCs). Survivals (left panel) are represented in the Kaplan–Meier plot and parasitemia (Right panel) by mean ± SD, monitored daily from day 3 post infection. Data pooled from three independent experiments (N = 7–12 mice per genotype), with a similar trend. (B) Quantification of labile heme in serum (Left panel) and renal heme (Right panel) at the peak of Pcc infection (2 × 10⁶ iRBC; day 7 post-infection) in Hp+/+Hpx+/+ and Hp−/−Hpx−/− mice. Data shown as mean ± SD from one experiment (N = 4–5 mice per genotype). P-values determined using two-way ANOVA. (C) Kidney Perl’s Prussian blue staining (non-heme Fe3+) from N = 4–5 mice per genotype (non-infected or Pcc-infected: 2 × 10⁶ iRBC, at the peak of infection: day 7 post-infection) in one experiment. Top panels show whole-kidney sections and bottom panels higher magnifications from the area highlighted. Arrowheads indicate Fe3+ (blue). GL, glomerulus; PT, proximal tubules. (C, D) Quantification of renal non-heme Fe3+ accumulation, detected in the same experiment as in (C). Data presented as mean ± SD (N = 4–5 mice per genotype). (E) Quantification of renal non-heme iron concentration, shown as mean ± SD (N = 4–5 mice per genotype). P-values in (D, E) determined using two-way ANOVA. NS, nonsignificant; *P < 0.05; **P < 0.01; ****P < 0.0001.
Source data are available for this figure.

