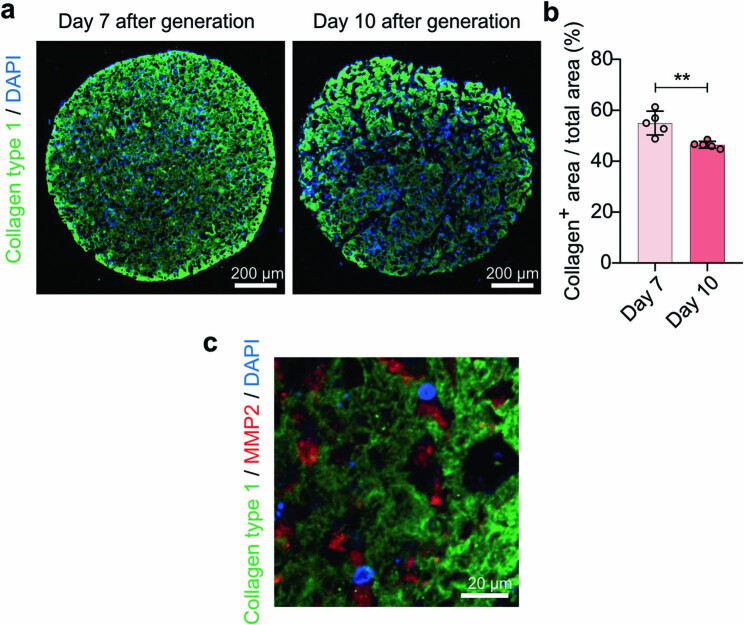
Extended Data Fig. 5. ECM remodeling in liver organoids.
(a) Fluorescent images of normal liver organoid sections stained with collagen type 1 on days 7 and 10 after organoid generation. DAPI was used for staining nuclei (n = 3 biological replicates in two experiments). (b) Bar graph quantifying the collagen+ area / total area (%) of liver organoids on days 7 and 10 after organoid generation (P value: 0.004374) (n = 5 biological replicates). Line and error bars represent mean ± s.d., and significance was determined using the unpaired two-sided t-test; **: p < 0.01. (c) Fluorescent image of normal liver organoid sections stained with collagen type 1 and MMP2 on day 7 after organoid generation. DAPI was used for staining nuclei (n = 3 biological replicates in two experiments).

