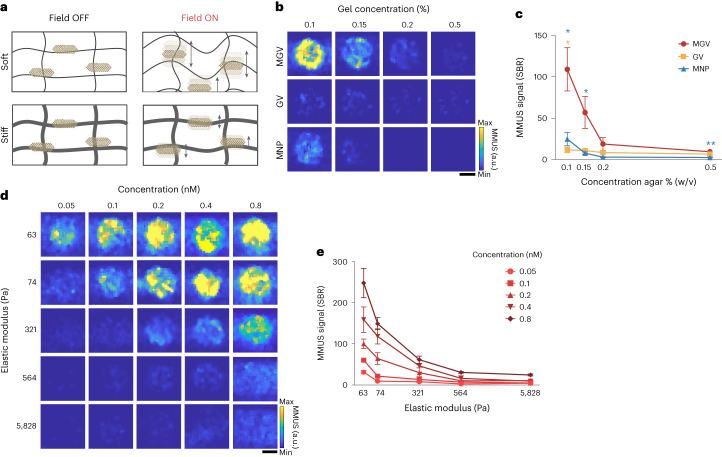
Fig. 2. Stiffness-dependent MMUS imaging.
a, Schematic illustration showing the movement of MGVs inside soft and stiff materials when an applied magnetic field is off and on. b,c, MMUS images (b) and SBR quantification (c) of agarose-concentration-dependent movement of MGVs ranging from 0.1% to 0.5% (w/v) agarose. P (blue, left–right) = 0.021665, 0.044665, 0.082836, 0.004661; P (yellow, left–right) = 0.010210, 0.054968, 0.228487, 0.231079. n = 4 independent experiments. d,e, MMUS images (d) and SBR quantification (e) based on different values of elastic modulus and concentration. n = 5 independent experiments. Scale bars, 1 mm. Min and max on the colour bars represent 0 and 10,000 arbitrary units, respectively. Lines and error bars represent mean ± s.e.m., and significance was determined using a multiple unpaired two-sided t-test (c) and one-way ANOVA with Tukey’s multiple-comparisons test (e): *P < 0.05, **P < 0.01, ***P < 0.001; ****P < 0.0001.

