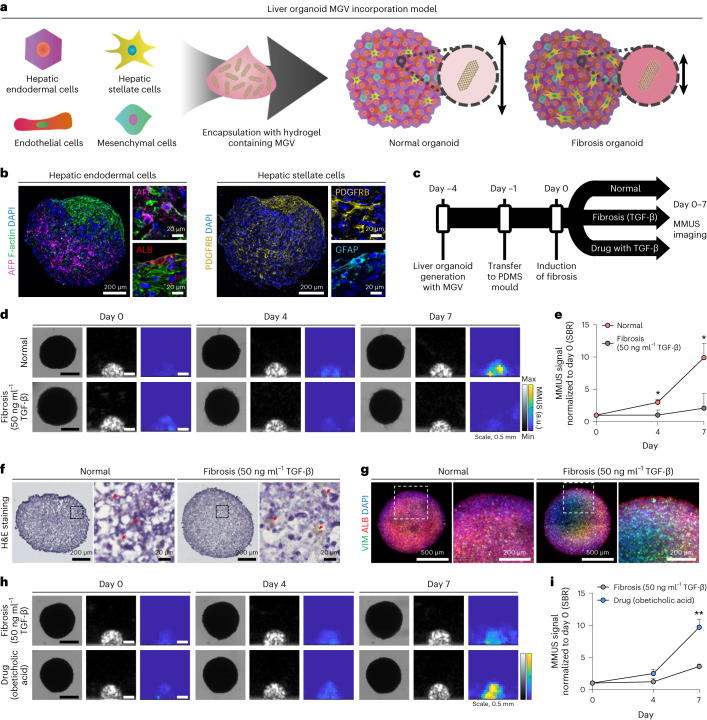
Fig. 4. MGV-based MMUS imaging for monitoring fibrosis in human liver organoid models.
a, Schematic illustration showing MGV encapsulation with four types of cells generating liver organoids and detecting fibrosis-related stiffness changes using MGVs. b, Immunofluorescent images showing the expression of hepatic endodermal cell markers (AFP and ALB) and hepatic stellate cell markers (PDGFRB, GFAP) in liver organoids 3 days after organoid generation. TRITC-conjugated phalloidin was used for cytoskeleton (F-actin) staining and DAPI was used for nuclear staining. n = 3 biological replicates examined in one experiment. The stained signals are presented in pseudocolour. c, Experimental timeline of the preparation of MGV-incorporated liver organoid models and MMUS imaging. d,e Bright-field, B-mode, MMUS images (d) and SBR quantification (e) of MGV-incorporated liver organoids (normal and fibrosis model). Images were taken from day 0 to day 7 after fibrosis induction. Quantification was conducted using relative MMUS SBR signal normalized to the day 0 value in normal and fibrosis groups. P (day 4–7) = 0.017975, 0.013180. n = 3 biological replicates examined in two experiments. f, H&E staining of organoid sections in normal and fibrosis groups. Red arrows indicate the localization of MGVs in the organoids. n = 2 biological replicates examined in two experiments. g, Immunofluorescent images of fibrotic marker (VIM) and mature hepatic marker (ALB) in normal and fibrosis groups. DAPI was used for nuclear staining. n = 2 biological replicates examined in two experiments. h,i, Bright-field, B-mode, MMUS images (h) and SBR quantification (i) of MGV-incorporated liver organoids in the fibrosis group (50 ng ml−1 TGF-β) and drug-treated fibrosis group (50 ng ml−1 TGF-β + 10 μM obeticholic acid). Images were taken from day 0 to day 7 after fibrosis induction. Quantification was conducted using relative MMUS SBR signal normalized to the day 0 value in fibrosis and drug-treated fibrosis groups. P (day 4–7) = 0.057215, 0.001129. n = 3 biological replicates examined in one experiment. Min and max on the parula (MMUS) and grey (B-mode) colour bars represent 0 and 20,000 arbitrary units. All lines and error bars represent mean ± s.d., and significance was determined using an unpaired two-sided t-test in e,i: *P < 0.05, **P < 0.01.

