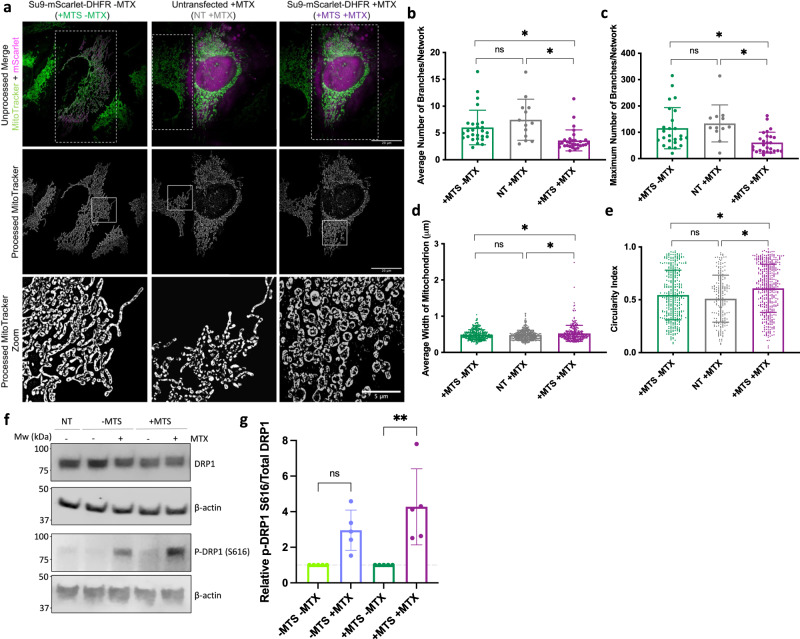
Fig. 2. Chronic precursor trapping alters mitochondrial morphology and dynamics.
a Representative SR 3D-SIM images showing mitochondria in HeLaGAL cells subjected to trapping ( + MTS + MTX; 48 h) or not ( + MTS - MTX). Not transfected (NT) cells in the same well as cells subjected to trapping were used as an internal control for MTX treatment (NT + MTX; 48 h). The top row shows a merge of MitoTracker Green (mitochondria; green) and mScarlet (trapping precursor; magenta) prior to image processing. The middle row shows mitochondria after image processing. Box shows zoom area. N = 3 biological replicates. b–e Quantification of mitochondrial morphology. For branching (b, c), each point represents an individual cell from a separate field of view. n = 27, 13, 30 cells for different conditions, respectively. P = 0.8181, 0.0323, 0.0422 (b), P = 0.8041, 0.0380, 0.0458 (c). For width (d), each point represents an individual mitochondrion, as an average of 5 measurements per mitochondrion from a region from a selected field of view (independent cell). n = 360, 470, 315 mitochondria, from 20 cells for each condition, respectively. P = 07661, 0.0332, 0.0158. For circularity (e), each point represents an individual mitochondrion. n = 359, 199, 434 mitochondria, respectively. P = 0.3502, 0.0117, 0.0447. f Representative Western blots showing the abundance of total DRP1 and phospho-DRP1 S616 in HeLaGAL cells over-producing EGFP-DHFR (- MTS) or Su9-EGFP-DHFR (+ MTS), or untransduced (NT) cells in the absence or presence of 100 nM MTX (48 h). β-actin was used as a loading control. N = 5 biological replicates. g Quantification of (f), normalised to β-actin loading control and respective ±MTS control. N = 5 biological replicates represented by individual data points. P = 0.0881, 0.0029. Statistical significance was determined using nested (b–e) or normal (g) one-way ANOVA and Tukey’s tests. Data are presented as mean values ± S.D., and P values are reported left-right, bottom-top (b–e, g). Source data and uncropped blots are provided in the Source Data file (b–e, g). DRP1 dynamin related protein 1, kDa kilodalton, MPP mitochondrial processing peptidase, mtHsp70 mitochondrial heat shock protein 70, MTS mitochondrial targeting sequence, MTX methotrexate, Mw molecular weight, NT not tranfected, p-DRP1 S616 DRP1 phosphorylated at Serine 616, SR 3D-SIM super-resolution three-dimensional structured illumination microscopy.

