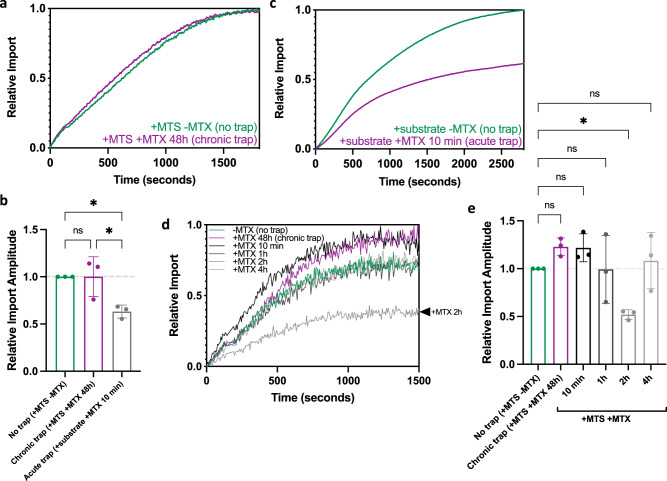
Fig. 3. Acute but not chronic precursor trapping impacts import yield.
a MitoLuc import trace following chronic trapping (48 h; purple), or no trapping (precursor imported; green). b Import amplitude following chronic trapping (48 h; purple), acute trapping (10 min; grey), or no trapping (precursor imported; green). P = 0.9999, 0.0283, 0.0289. c MitoLuc import trace following acute trapping (10 min; grey), or no trapping (precursor imported; green). MitoLuc import trace (d) and amplitudes (e) following in-cell precursor trapping for 48 h (purple; chronic trap), 10 min, 1 h, 2 h, or 4 h (grey; trap time course), or no trapping (precursor imported; green). P = 0.5263, 0.5672, >0.9999, 0.0488, 0.9792. N = 3 biological replicates, each with n = 3 technical replicates in HeLaGAL cells (a–e). Statistical significance was determined using one-way ANOVA and Tukey’s tests and P values are reported left-right, bottom-top (b, e). Data are presented as mean values ± S.D. with individual data points for each biological replicate (b, e) or as representative traces (a, c, d). Raw data are provided in the Source Data file (a–e). MTS mitochondrial targeting sequence, MTX methotrexate.

