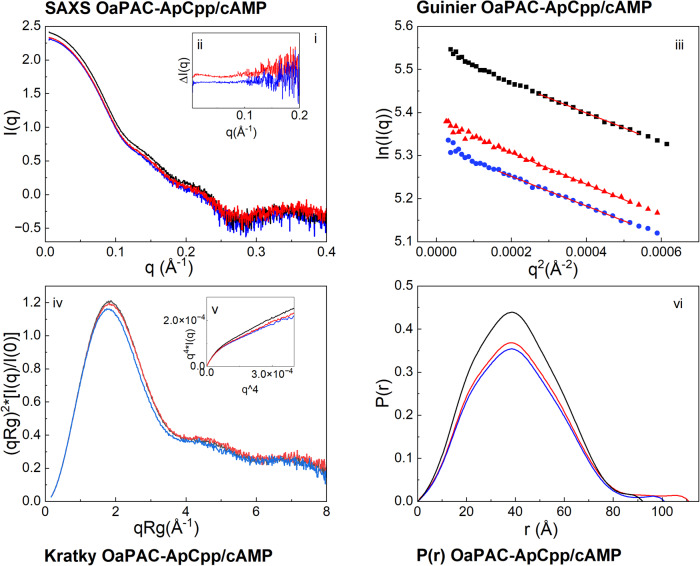
Fig. 4. SAXS data of the OaPAC complexes with ApCpp and cAMP.
(i) SAXS profiles of OaPAC and OaPAC in the presence of ApCpp and cAMP. (ii) Difference SAXS profiles of the OaPAC-ApCpp and OaPAC-cAMP complexes created after the subtraction of substrate-free OaPAC. (iii) Guinier plots, (iv) Kratky plots, (v) Porod-Debye plots, and (vi) Pair distribution function P(r) of OaPAC and of its complexes with ApCpp and cAMP. OaPAC (black line), OaPAC with ApCpp (red line), OaPAC with cAMP (blue line).

