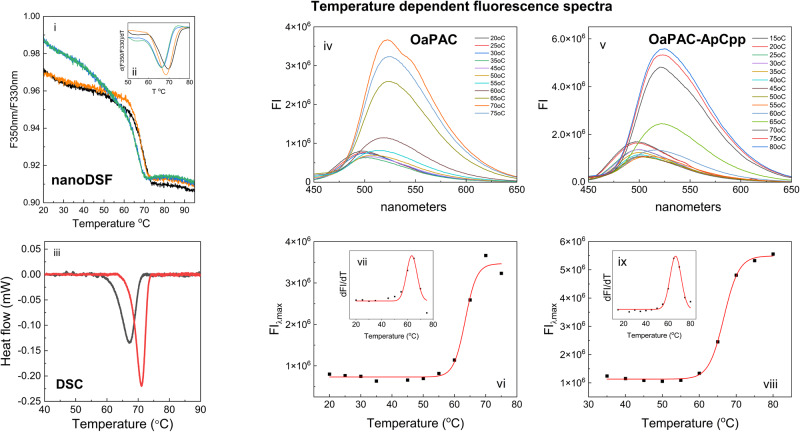
Fig. 6. Determination of melting temperatures for OaPAC and its complexes with ATP and ApCpp using fluorescence based nanoDSF, the DSC technique and emission of the flavin during enzyme unfolding.
(i) Tryptophan fluorescence ratio (F350nm/F330nm), (ii) the first derivative of the fluorescence ratio of OaPAC (green), OaPAC-ATP (orange), OaPAC-ApCpp (black) and cAMP (blue). (iii) DSC denaturation curves of OaPAC (black line) and its complex with ApCpp (red line). The heat flow measured in mW is plotted against temperature after baseline correction. (iv) temperature dependent fluorescence spectra of OaPAC. (v) temperature dependent fluorescence spectra of OaPAC and its complex with ApCpp. (vi) Plot of the emission maxima of OaPAC against the temperature (vii) First derivative of the fluorescence emission of OaPAC as a function of the temperature (viii) Plot of the emission maxima of the OaPAC-ApCpp complex against the temperature (ix) First derivative of the fluorescence emission of OaPAC as a function of the temperature.

