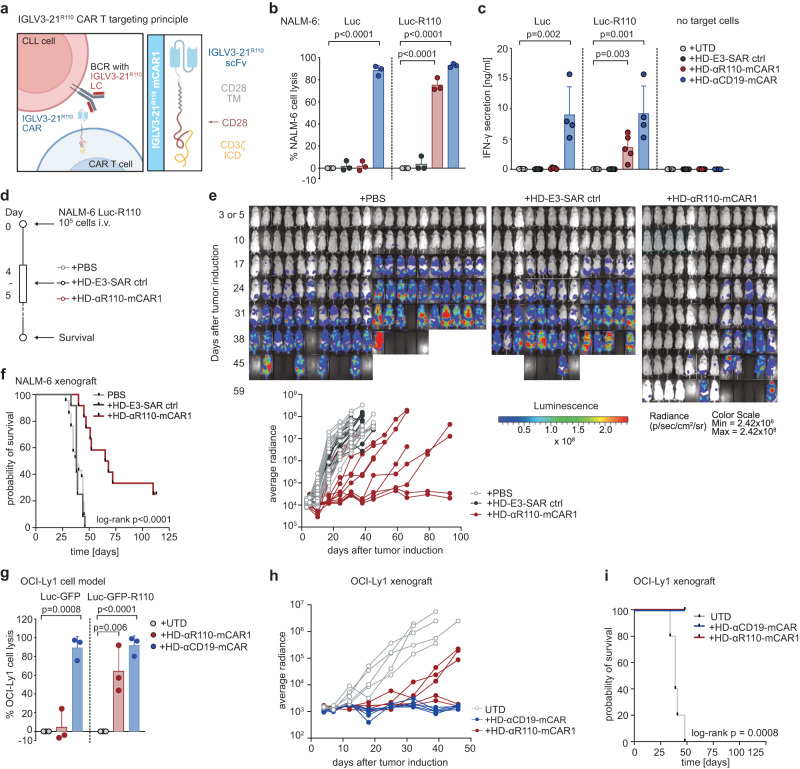
Fig. 1. Development of a chimeric antigen receptor (CAR) T cell targeting the IGLV3-21R110 neoepitope.
a Schematic representation of the IGLV3-21R110 CAR T targeting principle and the murine CAR construct (αR110-mCAR1). BCR B cell receptor, LC light chain, TMD transmembrane domain, ICD intracellular domain, Created with BioRender.com. b Percent tumor cell lysis based on a bioluminescence readout after 48 h co-culture of NALM-6 Luc or IGLV3-21R110 expressing NALM-6 Luc-R110 cells with indicated CAR T cells or untransduced T cells (UTDs) in an effector to target (E:T) ratio of 0.1:1. n = 3 for all groups. c Quantification of IFN-γ secretion in cell culture supernatants after 48 h co-culture of NALM-6 Luc model. n = 5 in all groups but HD-αCD19-mCAR1 (n = 4). d Schematic representation of the workflow for the NALM-6 Luc-R110 xenograft mouse model. e Bioluminescence measurements of NSG mice to assess in vivo activity of HD-αR110-mCAR1 T cells from healthy donors. NALM-6 Luc-R110 growth curves are shown based on in vivo bioluminescence imaging (days 3 or 5, 10, 17, 24, 31, 38, 45, 52, 59, 65 or 66, 79. 93). NSG mice were injected i.v. with NALM-6 Luc-R110 cells and treated either four or five days later with HD-αR110-mCAR1 T cells (n = 12), control HD-E3-SAR ctrl T cells (n = 12) or PBS vehicle solution (n = 21). f Kaplan-Meier survival plot of NALM-6 Luc-R110 mouse model. g Percent tumor cell lysis based on a bioluminescence readout after 48 h co-culture of OCI-Ly1 Luc-GFP or IGLV3-21R110 expressing OCI-Ly1 Luc-GFP-R110 cells with indicated CAR T cells in an effector to target (E:T) ratio of 0.1:1. n = 3 in all groups. h Bioluminescence measurements of NSG mice engrafted with OCI-Ly1 Luc-GFP-R110 cells to assess in vivo activity of HD-αR110-mCAR1 T cells from healthy donors. OCI-Ly1 Luc-GFP-R110 growth curves are shown based on in vivo bioluminescence imaging (days 4, 7, 12, 18, 25, 32, 39, 46). NSG mice were injected i.v. with OCI-Ly1 Luc-GFP-R110 cells and treated either eight days later with HD-αR110-mCAR1 T, HD-αCD19-mCAR T, or UTD cells (for all n = 5). i Kaplan-Meier survival plot of OCI-Ly1 mouse model. All bar plots represent the indicated mean ± SD calculated from independent experiments (n = 3–5). Statistics: one-sided t test; Log-rank test for survival data. Source data are provided as a Source Data file.

