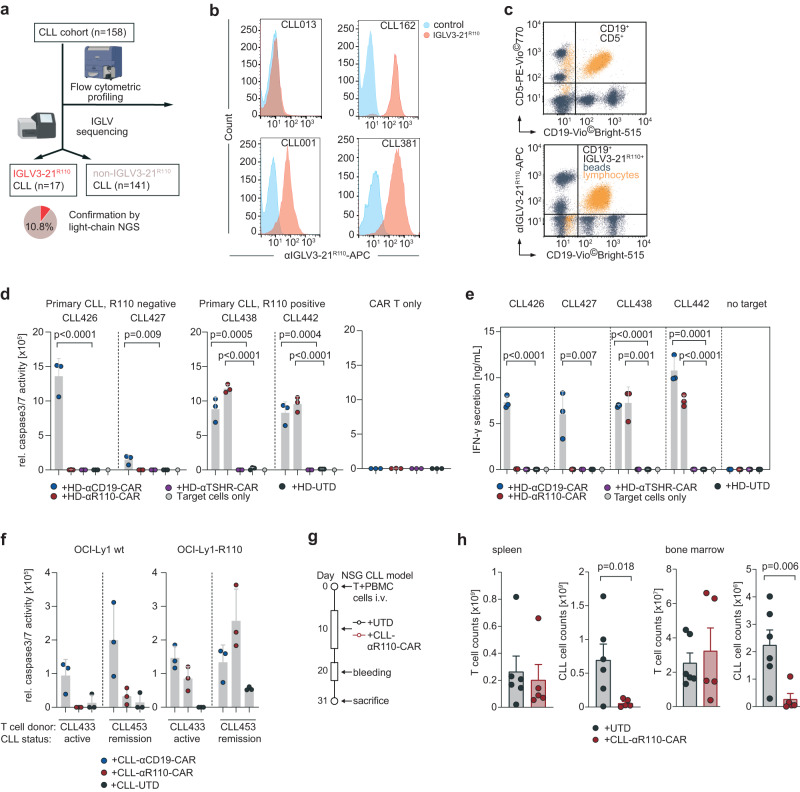
Fig. 4. In vitro and in vivo activity of IGLV3-21R110 healthy donor and CLL patient-derived CAR T cells against primary chronic lymphocytic leukemia (CLL) cells.
a IGLV3-21R110 light chain Screening work-flow of 158 CLL patients. Created with BioRender.com. b Exemplary results of three IGLV3-21R110-positive and one IGLV3-21R110-negative CLL case in a single color flow cytometric assay using APC-labelled IGLV3-21R110-specific antibody shown as histogram. c Exemplary staining of one IGLV3-21R110-positive CLL case with a bead-based assay (ApLifeTM FastScreenCLL) with triple staining of CD19, CD5 (CD19-CD5+ unaffected T cells) and IGLV3-21R110. d Cytolysis of freshly isolated primary CLL cells from IGLV3-21R110-positive (CLL438, CLL442) and IGLV3-21R110-negative (CLL426 and CLL427) CLL cases by different healthy donor derived CAR T cells including HD-αR110-CAR and anti-TSHR control CAR T cells (HD-αR110-CAR) as indicated and as compared to untransduced cells (UTD). The assay was conducted as in Fig. 2b–d; the 24 h time point is shown. All groups as independent triplicates, but the target only control (n = 1). e Quantification of IFN-γ in co-culture supernatants after 24 h incubation of indicated target/effector cell combinations of the assay shown in panel (d). All groups as independent triplicates, but the target only control (n = 1). f Quantification of OCI-Ly1-R110 cytolysis mediated by CLL patient-derived CAR T cells as compared to untransduced cells (UTD). The assay was conducted with two CLL patients serving as T cell donors, one with active CLL (CLL433) and one with CLL in remission (CLL453). The assay was performed as described in Fig. 2b–d; the 24 h time point is shown. Dots in individual patients represent technical replicates (n = 3). g Workflow for the patient-derived xenograft mouse model for CLL. h NSG mice were used to assess in vivo activity of CLL-αR110-CAR T cells from CLL donor CLL425 with IGLV3-21R110-positive CLL. Each mouse was injected i.v. with 0.5 million T cells and 20 million CLL cells collected from patient CLL425. Mice were i.p.-treated 10 days later with 7 million CLL-αR110-CAR T cells (n = 6) or untransduced cells (UTD, n = 6) from the same patient. Mice were then sacrificed at week 3 post CAR T cell injection. Only n = 5 measurements are shown for the CLL-CAR-αR110 T cell treated group since one mouse died of unknown reason. All bar plots represent the indicated mean ± SD. Statistics: one-sided t test. Source data are provided as a Source Data file.

