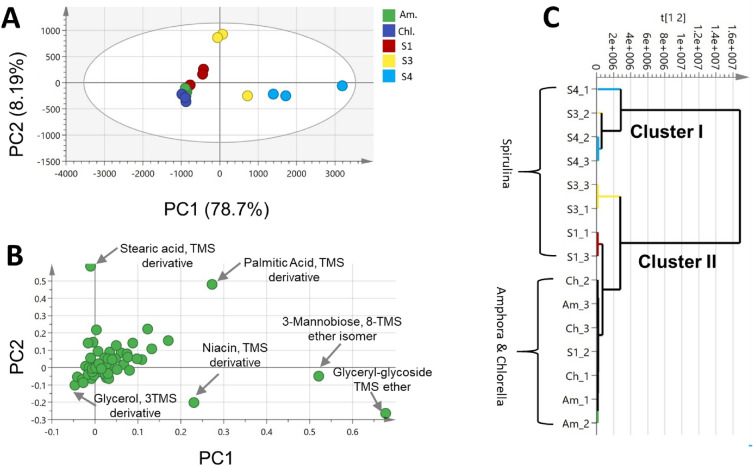
Figure 4.
Principal component analysis (PCA) and hierarchical clustering analysis (HCA) of GC–MS dataset of Spirulina (S1, S3 & S4), Amphora (Am.), Chlorella (Chl.). (A) Score plot of PC1 vs. PC2 scores. (B) Loading plot for PC1 & PC2 contributing metabolites and their assignments. The metabolome clusters are located at the distinct positions in two-dimensional space described by two vectors of principal component 1 (PC1) and principal component 2 (PC2) = 78.7% and PC2 = 8.2%. (C) HCA plot. Refer to Supplementary Table S3 for sample codes.

