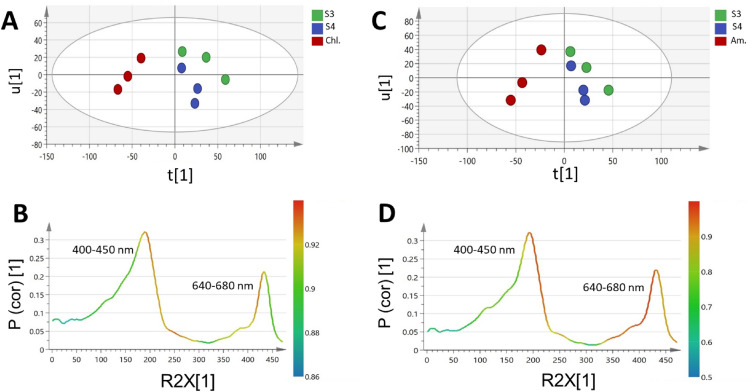
Figure 6.
OPLS score plot derived from UV–Vis dataset modelling of Spirulina (S3 & S4) samples against Chlorella (Chl.) and Amphora (Am.) samples each at a time (A,C). Their corresponding S-line plots (B,D) show the covariance p1 against the correlation p(cor)1 of the variables of the discriminating component of the OPLS-DA model. Cut-off values of P < 0.05 were used,selected variables are highlighted in the S-plot and discussed in text. Refer to Supplementary Table S3 for sample codes.

