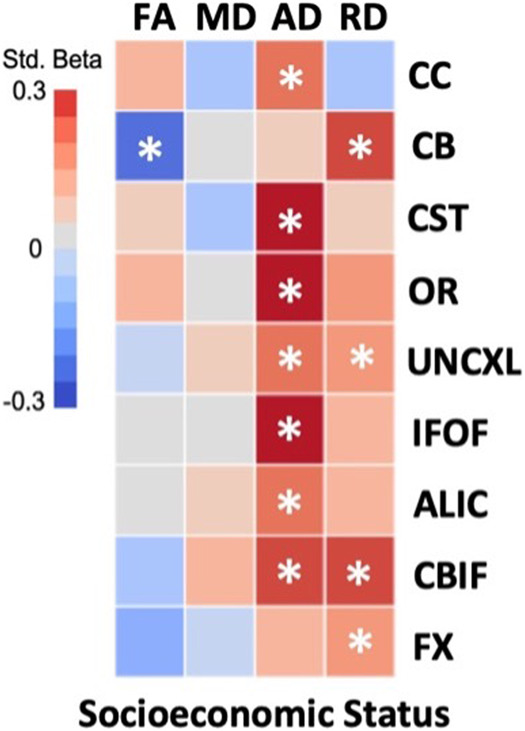
Fig. 1. Multiple linear regression heatmap of relationship between family socioeconomic status and neonatal white matter tract dMRI parameters.

Colors represent standardized beta values. Red = positive relationship. Blue = negative relationship. Covariates in models are child sex, gestational age at delivery, and infant postmenstrual age at scan. FA fractional anisotropy; MD mean diffusivity; AD axial diffusivity; RD radial diffusivity; CC corpus callosum; CB superior cingulum bundle; CST corticospinal tract; OR optic radiation; UNCXL uncinate fasciculus; IFOF inferior fronto-occipital fasciculus; ALIC anterior limb of internal capsule; CBIF inferior longitudinal fasciculus; FX fornix; SES socioeconomic status; *, significant after FDR correction for multiple comparisons.
