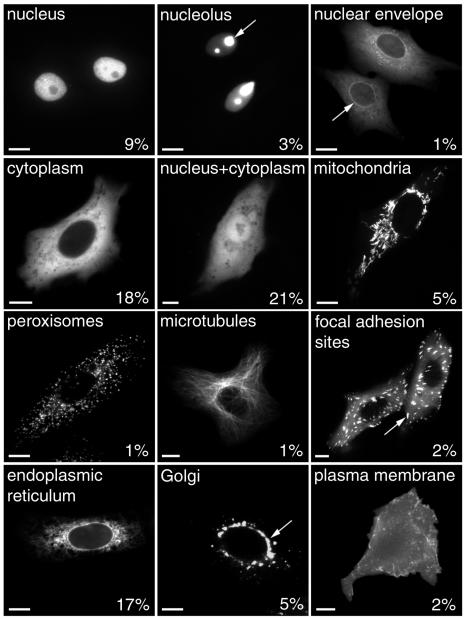
Fig. 2. cDNA–GFP fusions express and localize to a wide variety of intracellular compartments. Vero cells were transfected with each cDNA–GFP in turn, and allowed to express the proteins for the times stated in Methods. The cells were imaged live and the localizations recorded. The figure shows examples of twelve of the localizations observed, with arrows used to point out particular structures as appropriate. Numbers indicate the percentage of individual cDNA molecules that express and localize in the categories shown. Other categories not depicted are Golgi and plasma membrane localization (6%), other unknown localizations (8%) and no expression (1%). Bar, 10 µm.

An official website of the United States government
Here's how you know
Official websites use .gov
A
.gov website belongs to an official
government organization in the United States.
Secure .gov websites use HTTPS
A lock (
) or https:// means you've safely
connected to the .gov website. Share sensitive
information only on official, secure websites.
