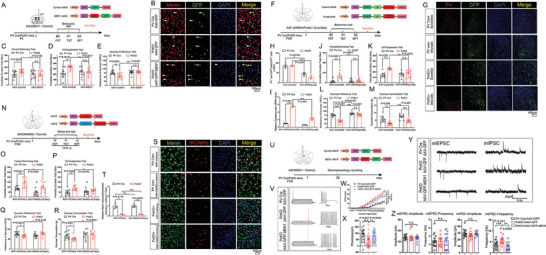
Figure 4.

Menin restoration, PV downregulation or PV neuronal activity inhibition in PV interneurons all rescue depressive behaviors in Men1‐PcKO mice. A) Schematic diagram of the structure of the MEN1‐AAV and associated workflow in mice. B) Double immunofluorescence staining to detect GFP (green) and Menin (red) in PV Cre+AAV‐GFP, PcKO+AAV‐GFP and PcKO+AAV‐GFP‐MEN1 mice cortex. Representative confocal images are shown in panel (B), Scale bar:100 µm. n = 3 mice. C–E) Behavioral analysis of AAV‐GFP‐MEN1 or AAV‐GFP injected PcKO and PV‐Cre mice by TST, FST, and SPT. F) Schematic diagram of the structure of the shpvalb‐AAV and associated workflow in mice. G,H) Immunofluorescence staining of PV and GFP in mPFC of mice received virous injection as labeled in panel G, Scale bar:100 µm. Quantitation of fluorescence intensity of PV in GFP+ cells is shown in panel (H), n = 3 mice. I) The mRNA levels of pvalb were measured by quantitative RT‐PCR in the cortex of the above mice, n = 3 mice. J–M) Behavioral analysis of AAV‐EGFP‐shRNA(Pvalb) or AAV‐EGFP‐shRNA(scramble) treated PcKO and littermate controls by FST, TST, SPT, and Sucrose Consumption Tests (SCT). N) Schematic diagram of the structure of the AAV‐hSyn‐DIO‐hM4D(Gi) and AAV‐hSyn‐DIO and associated workflow in mice. O–R) Behavioral analysis of AAV‐hSyn‐DIO‐hM4D(Gi) and AAV‐hSyn‐DIO injected PcKO and PV‐Cre mice by TST, FST, SPT and SCT. S,T) Immunofluorescence staining of Menin and mCherry in mPFC of mice received virous injection as labeled in panel (S), Scale bar:100 µm. Quantitation of fluorescence intensity of Menin in mCherry+ cells is shown in panel (T), n = 3 mice. U) Schematic diagram of the structure of the MEN1‐AAV and associated workflow in mice. V–X) Electrophysiological current‐clamp traces of action potential of PV interneurons from PV cre+AAV‐GFP, PcKO+AAV‐GFP and PcKO+AAV‐GFP‐MEN1 mice brain slices are shown in panel (V). Input‐output plot of PV interneurons from PV cre+AAV‐GFP, PcKO+AAV‐GFP and PcKO+AAV‐GFP‐MEN1 mice are shown in panel (W). The analysis of PV interneuron rheobase are shown in panel X (n>20 neurons from 3–6 mice each group). (Y, Z) Electrophysiological recording of mEPSC and mIPSC of PV interneuron from PV Cre+AAV‐GFP, PcKO+AAV‐GFP and PcKO+AAV‐GFP‐MEN1 mice. Representative whole‐cell recordings on PV interneurons in cortical slices of PV Cre+AAV‐GFP, PcKO+AAV‐GFP and PcKO+AAV‐GFP‐MEN1 mice are shown in panel (Y). Quantitation of their mEPSC and mIPSC frequency and amplitude are shown in panel (Z). (n = 15 cells from three mice each group) Mouse number used in behavior tests: PV cre+AAV‐GFP: n = 10 mice, PcKO+AAV‐GFP: n = 12 mice, PV cre + AAV‐GFP‐MEN1: n = 10 mice, PcKO+AAV‐GFP‐MEN1: n = 12 mice. PV cre+AAV‐EGFP‐shRNA(Scramble): n = 8 mice, PcKO+AAV‐EGFP‐shRNA(Scramble): n = 11 mice, PV cre + AAV‐EGFP‐shRNA(pvalb): n = 8 mice, PcKO+AAV‐ EGFP‐shRNA(pvalb): n = 13 mice. PV cre+ AAV‐hSyn‐DIO: n = 10 mice, PcKO+ AAV‐hSyn‐DIO: n = 10 mice, PV cre + AAV‐hSyn‐DIO‐hM4D(Gi): n = 10 mice, PcKO+ AAV‐hSyn‐DIO‐hM4D(Gi): n = 10 mice. Data represent mean±SEM, * p < 0.05, ** p < 0.01, *** p < 0.001. Unpaired t‐test for behavioral and electrophysiological statistics. Other statistical application between groups were analyzed by one‐way ANOVA with Tukey's post hoc analysis. See also Figure S11 (Supporting Information).
