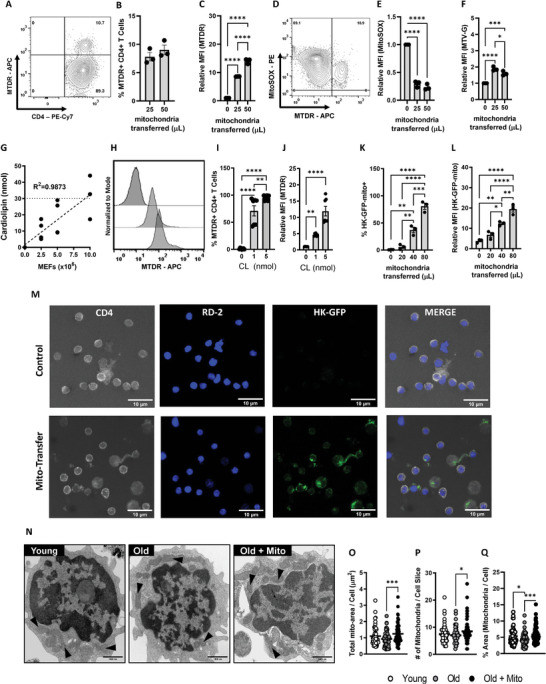
Figure 1.

Mito‐centrifugation efficiently delivers mitochondria to CD4+ T cells. A–F) Donor mitochondria were prestained with Mito‐tracker Deep Red (MTDR) and then transplanted into CD4+ T cells isolated from old mice via mito‐centrifugation. After mito‐transfer, cells were probed with MitoSOX to determine mitoROS production and MTV‐G to determine relative mitochondrial mass. A) Representative Contour plot and scatter bar graphs of B) the percent MTDR+ CD4+ T cells and C) the relative fold change in MFI of MTDR+ CD4+ T cells after mito‐transfer. D) Representative Contour plot and scatter bar graphs of E) relative MFI of MitoSOX Red and F) MTV‐G in CD4+ T cells from old mice after mito‐transfer. G) Cardiolipin concentration curve of isolated mitochondria from MEFs. Cardiolipin experiments were repeated twice with 3‐4 mice per group. H) Flow cytometry histograms and scatter bar graphs of I) percent MTDR+ CD4+ T cells, and J) relative MFI of MTDR+ CD4+ T cells after mito‐transfer, based on cardiolipin concentration. Flow cytometry scatter bar graphs of K) percent HK‐GFP+ CD4+ T cells, and L) the relative MFI of HK‐GFP+ CD4+ T cells after mito‐transfer. M) Confocal images of CD4+ T cells with or without donor mitochondria (HK‐GFP+). N) TEM images mitochondrial distributions (black arrows) in CD4+ T cells (young, old, and old+mito). Quantifications of O) total mitochondrial area, P) the number of mitochondria, and Q) percent area of mitochondria per cell area (in image slice) of CD4+ T cells isolated from young and old mice, and old mice ∼5–6 min after mito‐transfer. TEM images were obtained from 2 mice per groups. All other experiments were done with minimum three biological replicates (n=3). p ≤ 0.05 = *, p ≤ 0.01 = **, p ≤ 0.001 = *** and p ≤ 0.001 = ****, using unpaired Student's t‐test, or one‐way‐ANOVA where appropriate.
