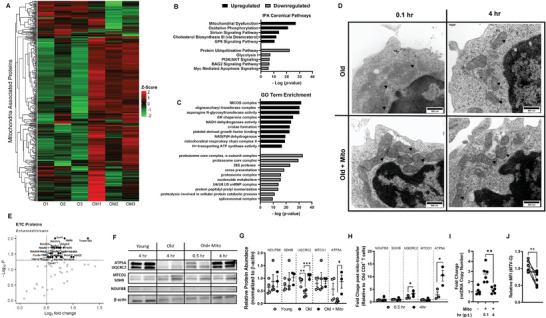
Figure 3.

Mito‐transfer alters mitochondrial gene expression and mitochondrial ultrastructure. A) Heatmap of the mitochondrial proteome in CD4+ T cells from old mice with and without mito‐ transfer. B) Top 5 upregulated and downregulated Canonical pathways (IPA) and the C) top 10 upregulated and downregulated GO Term enrichment of old CD4+ T cells after mito‐transfer. D) TEM images of mitochondrial cristae morphology in CD4+ T cells from old mice with and without mito‐transfer at ∼5 min and 4 h after mito‐transfer. E) Volcano plot of electron transport chain (ETC) proteome detected in CD4+ T cells from old mice with and without mito‐transfer, 4 h after mito‐transfer. F) Western blot images and, G) relative protein abundance in CD4+ T cells isolated from young and old mice, and CD4+ T cells from old mice 4 h after mito‐transfer. H) Fold change in ETC proteins in CD4+ T cells from old mice after mito‐transfer (at 30 min and 4 h). Proteomic experiments were performed once with 3 mice per group and internally normalized to β‐actin. I) Fold change in mtDNA copy number in CD4+ from old mice after mito‐transfer (at 5 min and 4 h). J) Relative MFI of MTV‐G in CD4+ T cells from old mice (grey) and CD4+ T cells from old mice (4h) after mito‐transfer. p ≤ 0.05 = * or p ≤ 0.01 = **, using paired and unpaired Students' t‐test where appropriate.
