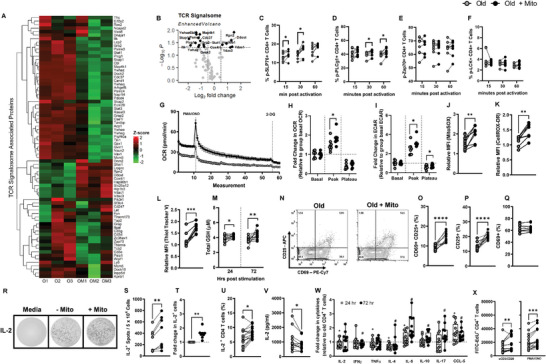
Figure 5.

Mito‐transfer improves T cell activation and cytokine production in CD4+ T cells from old mice. The CD4+ T cells from old mice with and without mito‐transfer were evaluated for activation capabilities. A) Heatmap and B) volcano plot of TCR signalosome proteome detected in CD4+ T cells isolated from old mice with or without mito‐transfer. The phosphorylation kinetics of TCR‐related proteins C) SLP76, D) PLCg1, E) Zap70, and F) LCK in CD4+ T cells from old mice with or without mito‐transfer, at 15, 30, and 60 min post activation with αCD3/αCD28 stimulation. G) OCR micrograph of CD4+ T cells from old mice with or without mito‐transfer, after acute activation with PMA/IONO. The relative fold changes in H) OCR and I) ECAR of CD4+ T cells isolated from old mice with or without mito‐transfer after acute activation with PMA/Ionomycin. The relative MFI of J) MitoSOX Red and K) CellROX Deep Red stained CD4+ T cells from old mice with or without mito‐transfer, after stimulation PMA/Ionomycin (4h). L) Thiol‐tracker violet and the M) total GSH produced by CD4+ T cells from old mice with or without mito‐transfer after stimulation with PMA/IONO. N) Contour plots of CD25 v CD69 expression on CD4+ T cells with and without mito‐transfer, after PMA/Ionomycin stimulation (24 h). The percent of O) CD25+ CD69+, P) CD25+ and, Q) CD69+ CD4+ T cells from old mice with or without mito‐transfer, at stimulation with PMA/Ionomycin (24h). R) Representative EliSpot images, the S) number IL‐2+ producing T cells and the T) fold change in IL‐2+ producing CD4+ T cells from old mice with or without mito‐transfer, after stimulation with PMA/Ionomycin (24h). The U) percent of IL‐2+ CD4+ T cells via intracellular cytokine staining, in CD4+ T cells from old mice with or without mito‐ transfer, after stimulation with PMA/Ionomycin (4h). V) Soluble IL‐2 detected in the supernatants of PMA/Ionomycin‐ stimulated (24 h) CD4+ T cells from old mice with or without mito‐transfer. The relative fold change in cytokine production of PMA/Ionomycin‐ stimulated CD4+ T cells from old mice with or without mito‐transfer, at 24 & 72 h after stimulation. X) Number of EdU+ cells in αCD3/αCD28 or PMA/Ionomycin‐stimulated CD4+ T cell cultures from old mice with or without mito‐transfer. All experiments were at least repeated (n=2), p ≤ 0.05 = *, p ≤ 0.01 = **, or p ≤ 0.001 = *** using paired Student's t‐test.
