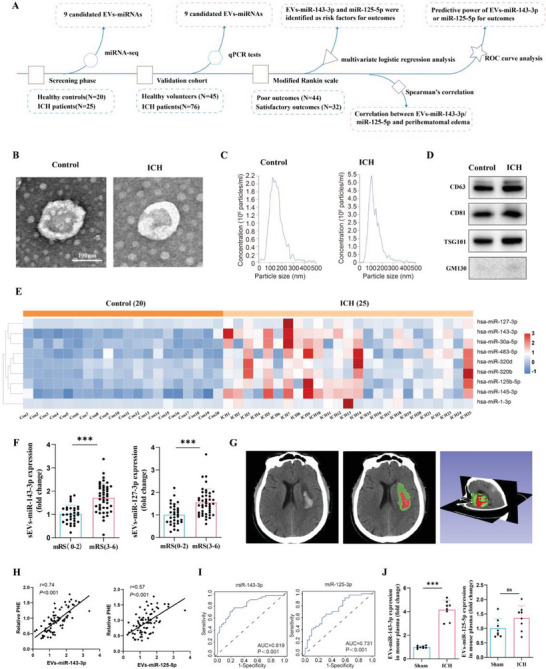
Figure 1.

Serum level of EVs‐miR‐143‐3p correlated with perihematomal edema, as well as neurological outcomes in patients with ICH. A) Scheme showing the design of the clinical research section. B) Transmission electron microscopy (TEM) analysis and C) nanoparticle tracking analysis (NTA) of the isolated EVs. Scale bar, 100 nm. D) Western blotting analysis of the EVs marker proteins including CD63, CD81, and TSG101, and cis‐Golgi marker protein, GM130. E) Heatmap showing the differently expressed EVs‐packaged miRNAs between ICH patients and healthy controls in miRNA‐seq data (ICH = 25, CON = 20; log2FC ≥2 and p < 0.05). F) Relative plasma EVs‐miR‐143‐3p and EVs‐miR‐125‐5p levels on the 1st day in patients with good (mRS 0 to 2) outcomes versus poor (mRS 3 to 6) outcomes 6 months later. n = 32 in good outcome group and n = 44 in poor outcome group. mRS: modified Rankin score. G) The representative CT image and 3D reconstruction process denote a hematoma and a perihematomal region in the right hemisphere of the brain from patients with ICH, where the red color represents the hematoma area and the green color represents the edema area. H) Pearson correlation coefficient (r) and P value (P) between plasma EVs‐miR‐143‐3p or EVs‐miR‐125‐5p and relative PHE (PHE/hematoma) in ICH patients (n = 76). PHE: perihematomal edema. I) ROC curve for individual plasma EVs‐miR‐143‐3p or EVs‐miR‐125‐5p expression on day 1 to separate good (mRS = 0–2) outcomes from poor (mRS = 3–6) outcomes 6 months later. J) Detection of EVs‐miR‐143‐3p and EVs‐miR‐125‐5p levels in the plasma of mice (n = 8 per group; Student's t‐test). Data are expressed as mean ± SD. *p < 0.05; **p < 0.01; ***p < 0.001.
