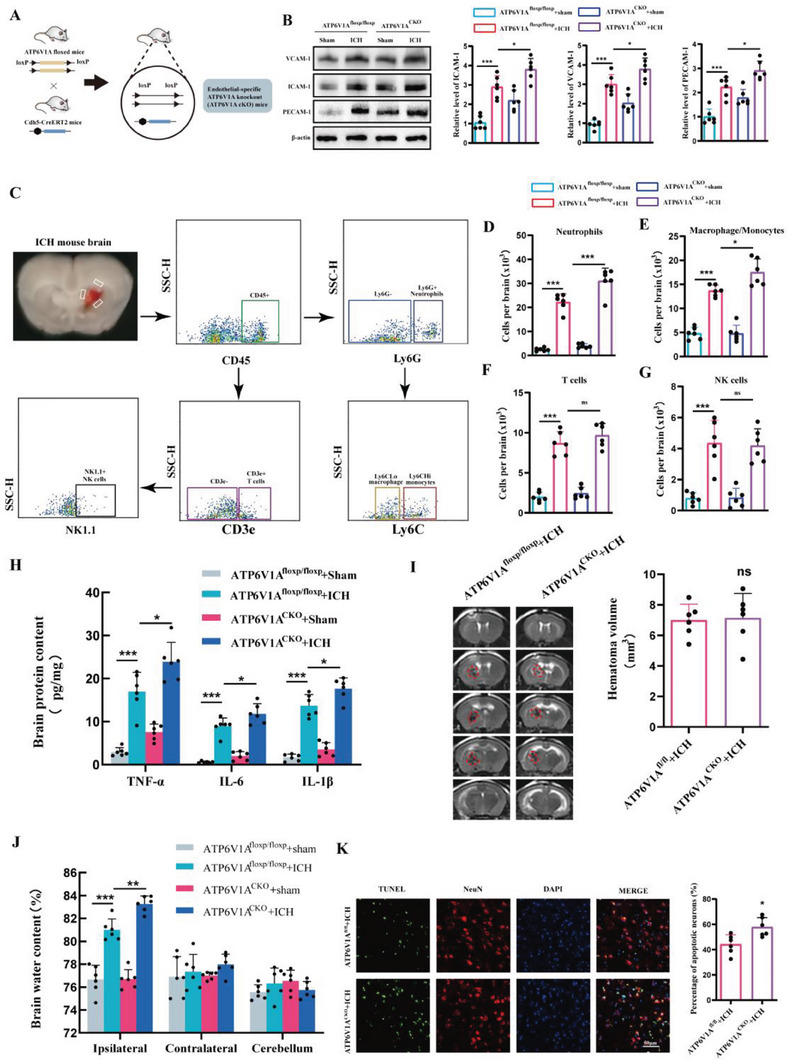
Figure 4.

Endothelial‐specific ATP6V1A knockout increased CAMs expression and neutrophil infiltration after ICH in mice. A) Establishment of endothelial‐specific ATP6V1A knockout mice. B) Western blot assay of the expression of CAMs including VCAM‐1, PECAM‐1, and ICAM‐1 at 24 h post‐ICH in ATP6V1A fl/fl and ATP6V1A CKO mice (n = 6 per group, one‐way ANOVA). C) Representative gating strategy for flow cytometric analysis of immune cells in the brain at 24 h post‐ICH in ATP6V1A fl/fl and ATP6V1A CKO mice. D–G) Cell surface antibodies were used to identify different cell types including D) Ly6G+ neutrophils, E) Ly6G− Ly6C macrophage/monocytes, F) CD3e+ T cells, G) NK1.1+ NK cells (n = 6 per group, one‐way ANOVA). H) The expression of IL‐1β, IL‐6, and TNF‐ɑ in the brain at 24 h after ICH in ATP6V1A fl/fl and ATP6V1A CKO mice was analyzed by ELISA (n = 6 mice per group, one‐way ANOVA). I) MRI images and quantification of hematoma at 24 h after ICH in ATP6V1A fl/fl and ATP6V1A CKO mice. Red lines delineate the lesion area. (n = 6 per group, one‐way ANOVA). J) Brain water content at 24 h after ICH in ATP6V1A fl/fl and ATP6V1A CKO mice (n = 6 per group, one‐way ANOVA). K) Representative images and statistical analysis of TUNEL‐positive cells in mice brain sections. Data are represented as the percentage of TUNEL‐positive cells (n = 6 per group, Student's t‐test). Scale bar: 50 µm. Data are presented as means ± SD. *p < 0.05, **p < 0.01, ***p < 0.001.
