
Figure 7.
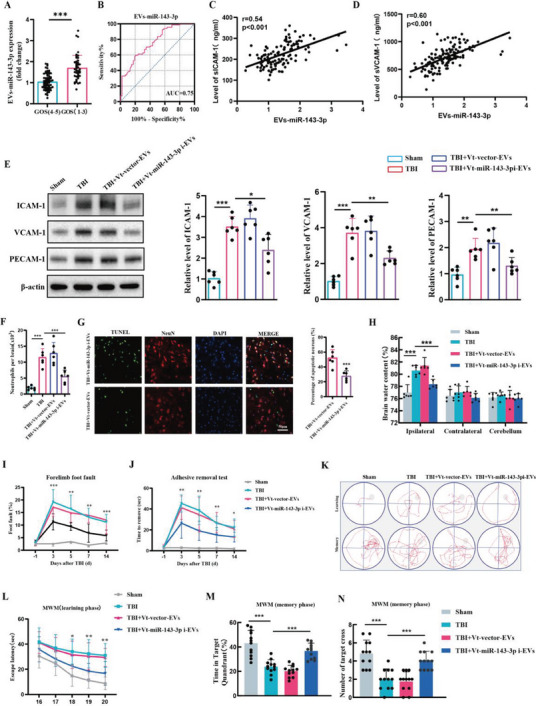
The detrimental role of EVs‐miR‐143‐3p in TBI and the therapeutic effects of Vt‐miR‐143‐3pi‐EVs treatment. A) Relative plasma EVs‐miR‐143‐3p level on the 1st day in TBI patients with poor (GOS 1–3) outcomes versus good (GOS 4–5) outcomes 6 months later. n = 67 in good outcome group and n = 46 in poor outcome group. GOS:Glasgow Outcome Scale. B) ROC curve for individual serum EVs‐miR‐143‐3p level on day 1 to separate poor (GOS 1–3) outcomes versus good (GOS 4–5) outcomes 6 months later. C,D) Pearson analyses of the correlations of EVs‐miR‐143‐3p with the serum levels of s‐VCAM‐1, and s‐ICAM‐1 within 24 h after TBI onset in patients (n = 113). E) Western blot assay of the effects of Vt‐miR‐143‐3pi‐EVs on the expression of CAMs including ICAM‐1, VCAM‐1, and PECAM‐1 in BMECs at 24 h post‐TBI in each group mice (n = 6 per group, one‐way ANOVA). F) Flow cytometric analysis of the effects of Vt‐miR‐143‐3pi‐EVs on the infiltration of Ly6G+ neutrophils in the brain at day 1 post‐TBI in mice (n = 6 per group, one‐way ANOVA). G) Representative images and statistical analysis of TUNEL‐positive cells in mice brain sections at 24 h post‐TBI in each group mice (n = 6 per group, Student's t‐test). Data are represented as the percentage of TUNEL‐positive cells. Scale bar: 50 µm. H) Measurement of brain water content at 24 h after TBI in each group mice (n = 6 per group, one‐way ANOVA). I–N) Several behavioral tests including foot fault test, adhesive test, and Morris water maze (MWM) test were conducted to determine the neurological function of mice (n = 12 per group, I, J, and L for two‐way ANOVA, M for one‐way ANOVA). Data are presented as means ± SD. *p < 0.05, **p < 0.01, ***p < 0.001.