Figure 1.

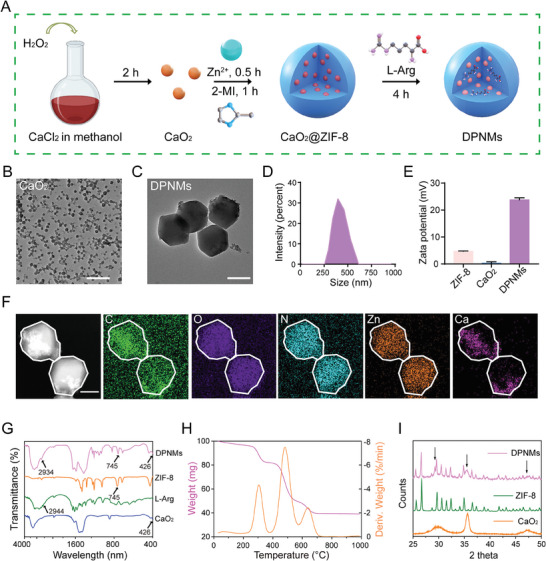
Synthesis and structural characterization of DPNMs. A) Schematic illustration of the synthesis of DPNMs. B) The TEM image of CaO2 naparticles. Scale bar, 200 nm. C) The TEM image of DPNMs. Scale bar, 200 nm. D) The size distribution of DPNMs detected by DLS. E) The zeta potentials of ZIF‐8, CaO2 nanoparticles, and DPNMs. F) The dark field image and corresponding elemental mappings of C, O, N, Zn, and Ca of DPNMs. Scale bar, 100 nm. G) The Fourier‐transform infrared (FTIR) spectrum of ZIF‐8, CaO2 nanoparticles, L‐Arg, and DPNMs. H) The thermogravimetric analysis of DPNMs. I) XRD pattern of the ZIF‐8, CaO2, and DPNMs.
