
Figure 4.
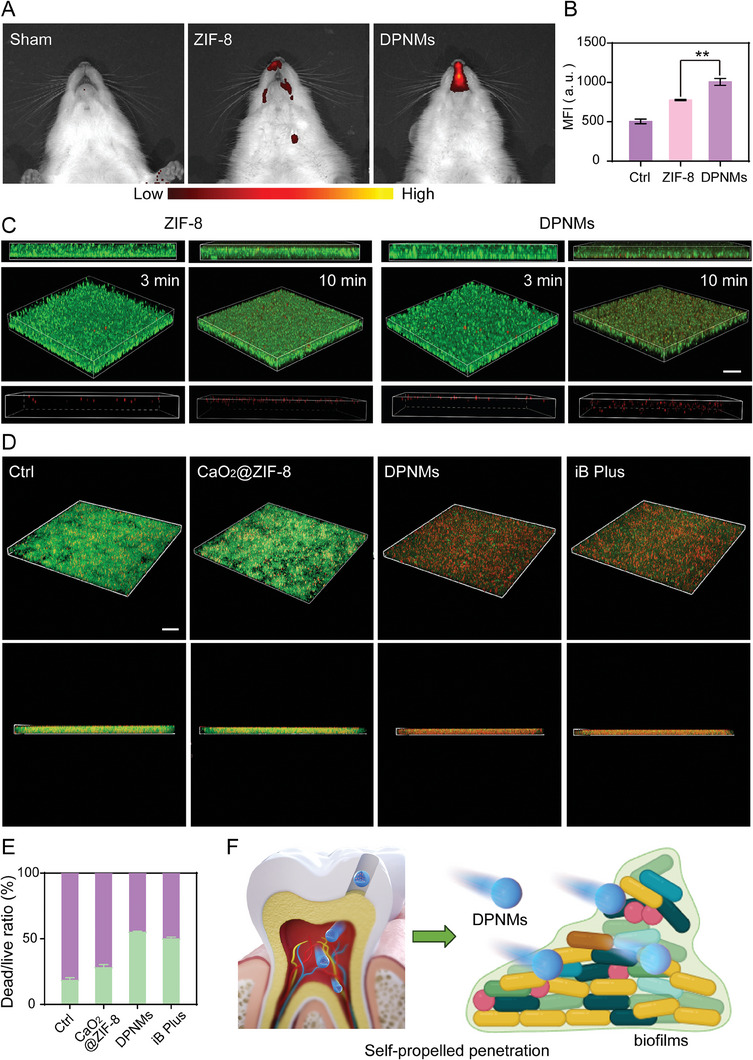
The evaluation of penetration ability of DPNMs. A) The IVIS imaging of Cy5‐labelled DPNMs in rats and B) the quantification of mean fluorescence intensity (MFI). Data are presented as mean ± SD (n = 3, one‐way ANOVA and Sidak's multiple comparison tests, **p < 0.01 versus ZIF‐8 group). C) 3D CLSM images and corresponding z‐stack images of mixed bacteria biofilms treated with Cy5‐labeled ZIF‐8 and DPNMs for 3 and 10 min. Scale bar: 30 µm. D) 3D CLSM images of mixed bacteria biofilms (green fluorescence: mixed bacteria biofilms stained with SYTO 9; red fluorescence: PI). Scale bar: 10 µm. E) The quantitative analysis of the dead/live ratio of bacteria. Data are presented as mean ± SD (n = 3). F) Illustration of NO‐propelled penetration in pulp tissue and biofilms.