
Figure 6.
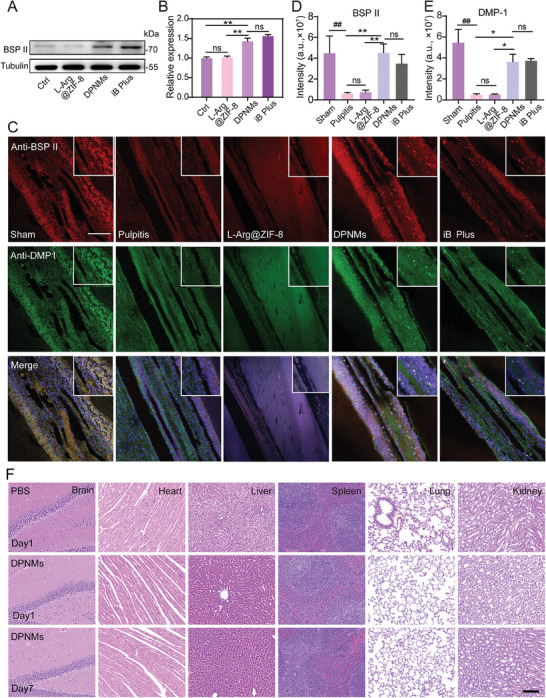
The osteogenic differentiation potential of DPSCs. A) Expression levels of BSP II in different groups by western blot. B) The quantization of BSP II expression by ImageJ software (n = 3). C) Immunofluorescence co‐staining of BSP II (red) and DMP1 (green) by CLSM in different groups. Scale bar = 100 µm. D, E) Quantitative analysis of the MFI of BSP II (D) and DMP1 (E) in immunofluorescence co‐staining results (n = 3). F) Representative images of H&E staining in the brain, heart, liver, spleen, lung, and kidney from WT mice with different treatments. Scale bar = 100 µm. (B, C, D) Data are presented as mean ± SD (one‐way ANOVA and Sidak's multiple comparison tests, ## p < 0.01 versus sham group, and * p < 0.05, ** p < 0.01 versus pulpitis group or DPNMs group, ns means no significance).