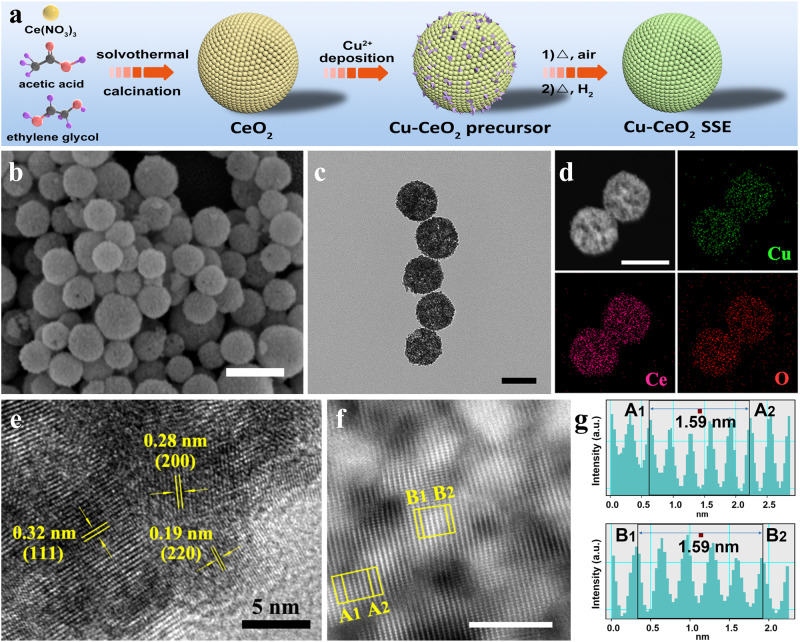
Fig. 1. Schematic illustration and morphology characterization for the Cu-CeO2 catalyst.
a Schematic illustration of the synthetic procedure of Cu-CeO2 sample, b Scanning electron microscopy images of Cu-CeO2 catalyst (scale bar: 200 nm), c Representative TEM image of Cu-CeO2 catalyst (scale bar: 100 nm), d TEM image and corresponding elemental mapping of Cu, O and Ce recorded on the nanoparticles (scale bar: 100 nm), e HRTEM images of Cu-CeO2 catalyst, f AC-HAADF-STEM image of Cu-CeO2 catalyst (scale bar: 5 nm), g Corresponding Z-contrast analysis of region A and B in (f). All experiments were independently repeated three times with similar results.

