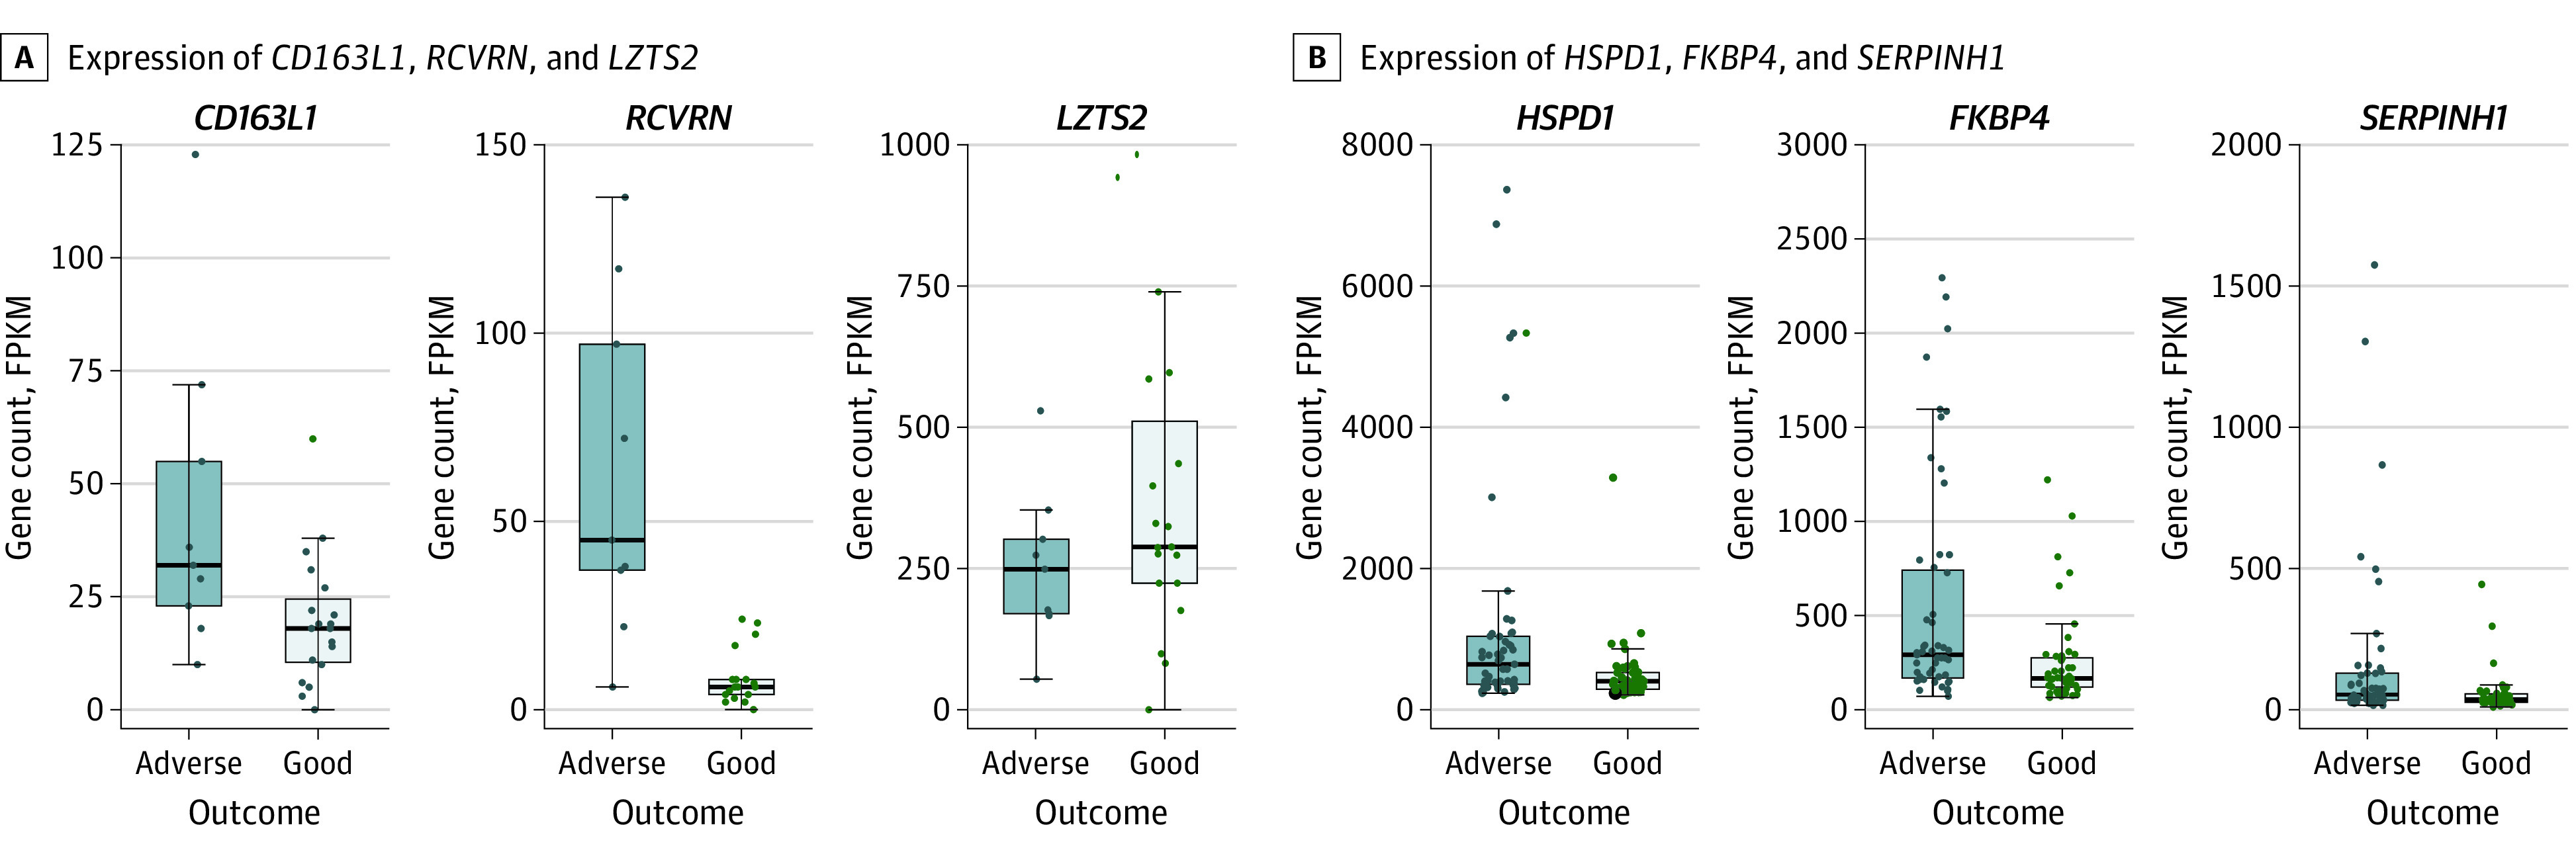
Figure 1. Comparison of Neonates With Hypoxic-Ischemic Encephalopathy With Adverse and Good Outcomes.

Gene count values are expressed as fragments per kilobase of transcript per million mapped reads (FPKM). Each box plot constitutes upper and lower bounds representing the first and third quartiles and a horizontal line representing the median. Boundaries of the whiskers are based on the 1.5 IQR value; all data points outside the boundary are outliers. Each dot represents a patient’s gene count. A, CD163L1, RCVRN, and LZTS2 were the 3 most significant genes after comparison of neonates with HIE with adverse and good outcomes in a high-income country (HIC). B, HSPD1, FKBP4, and SERPINH1 were the 3 most significant genes after comparison of neonates with HIE with adverse and good outcomes in South Asia. All 3 genes displayed a higher expression in the adverse vs the good outcome group.
