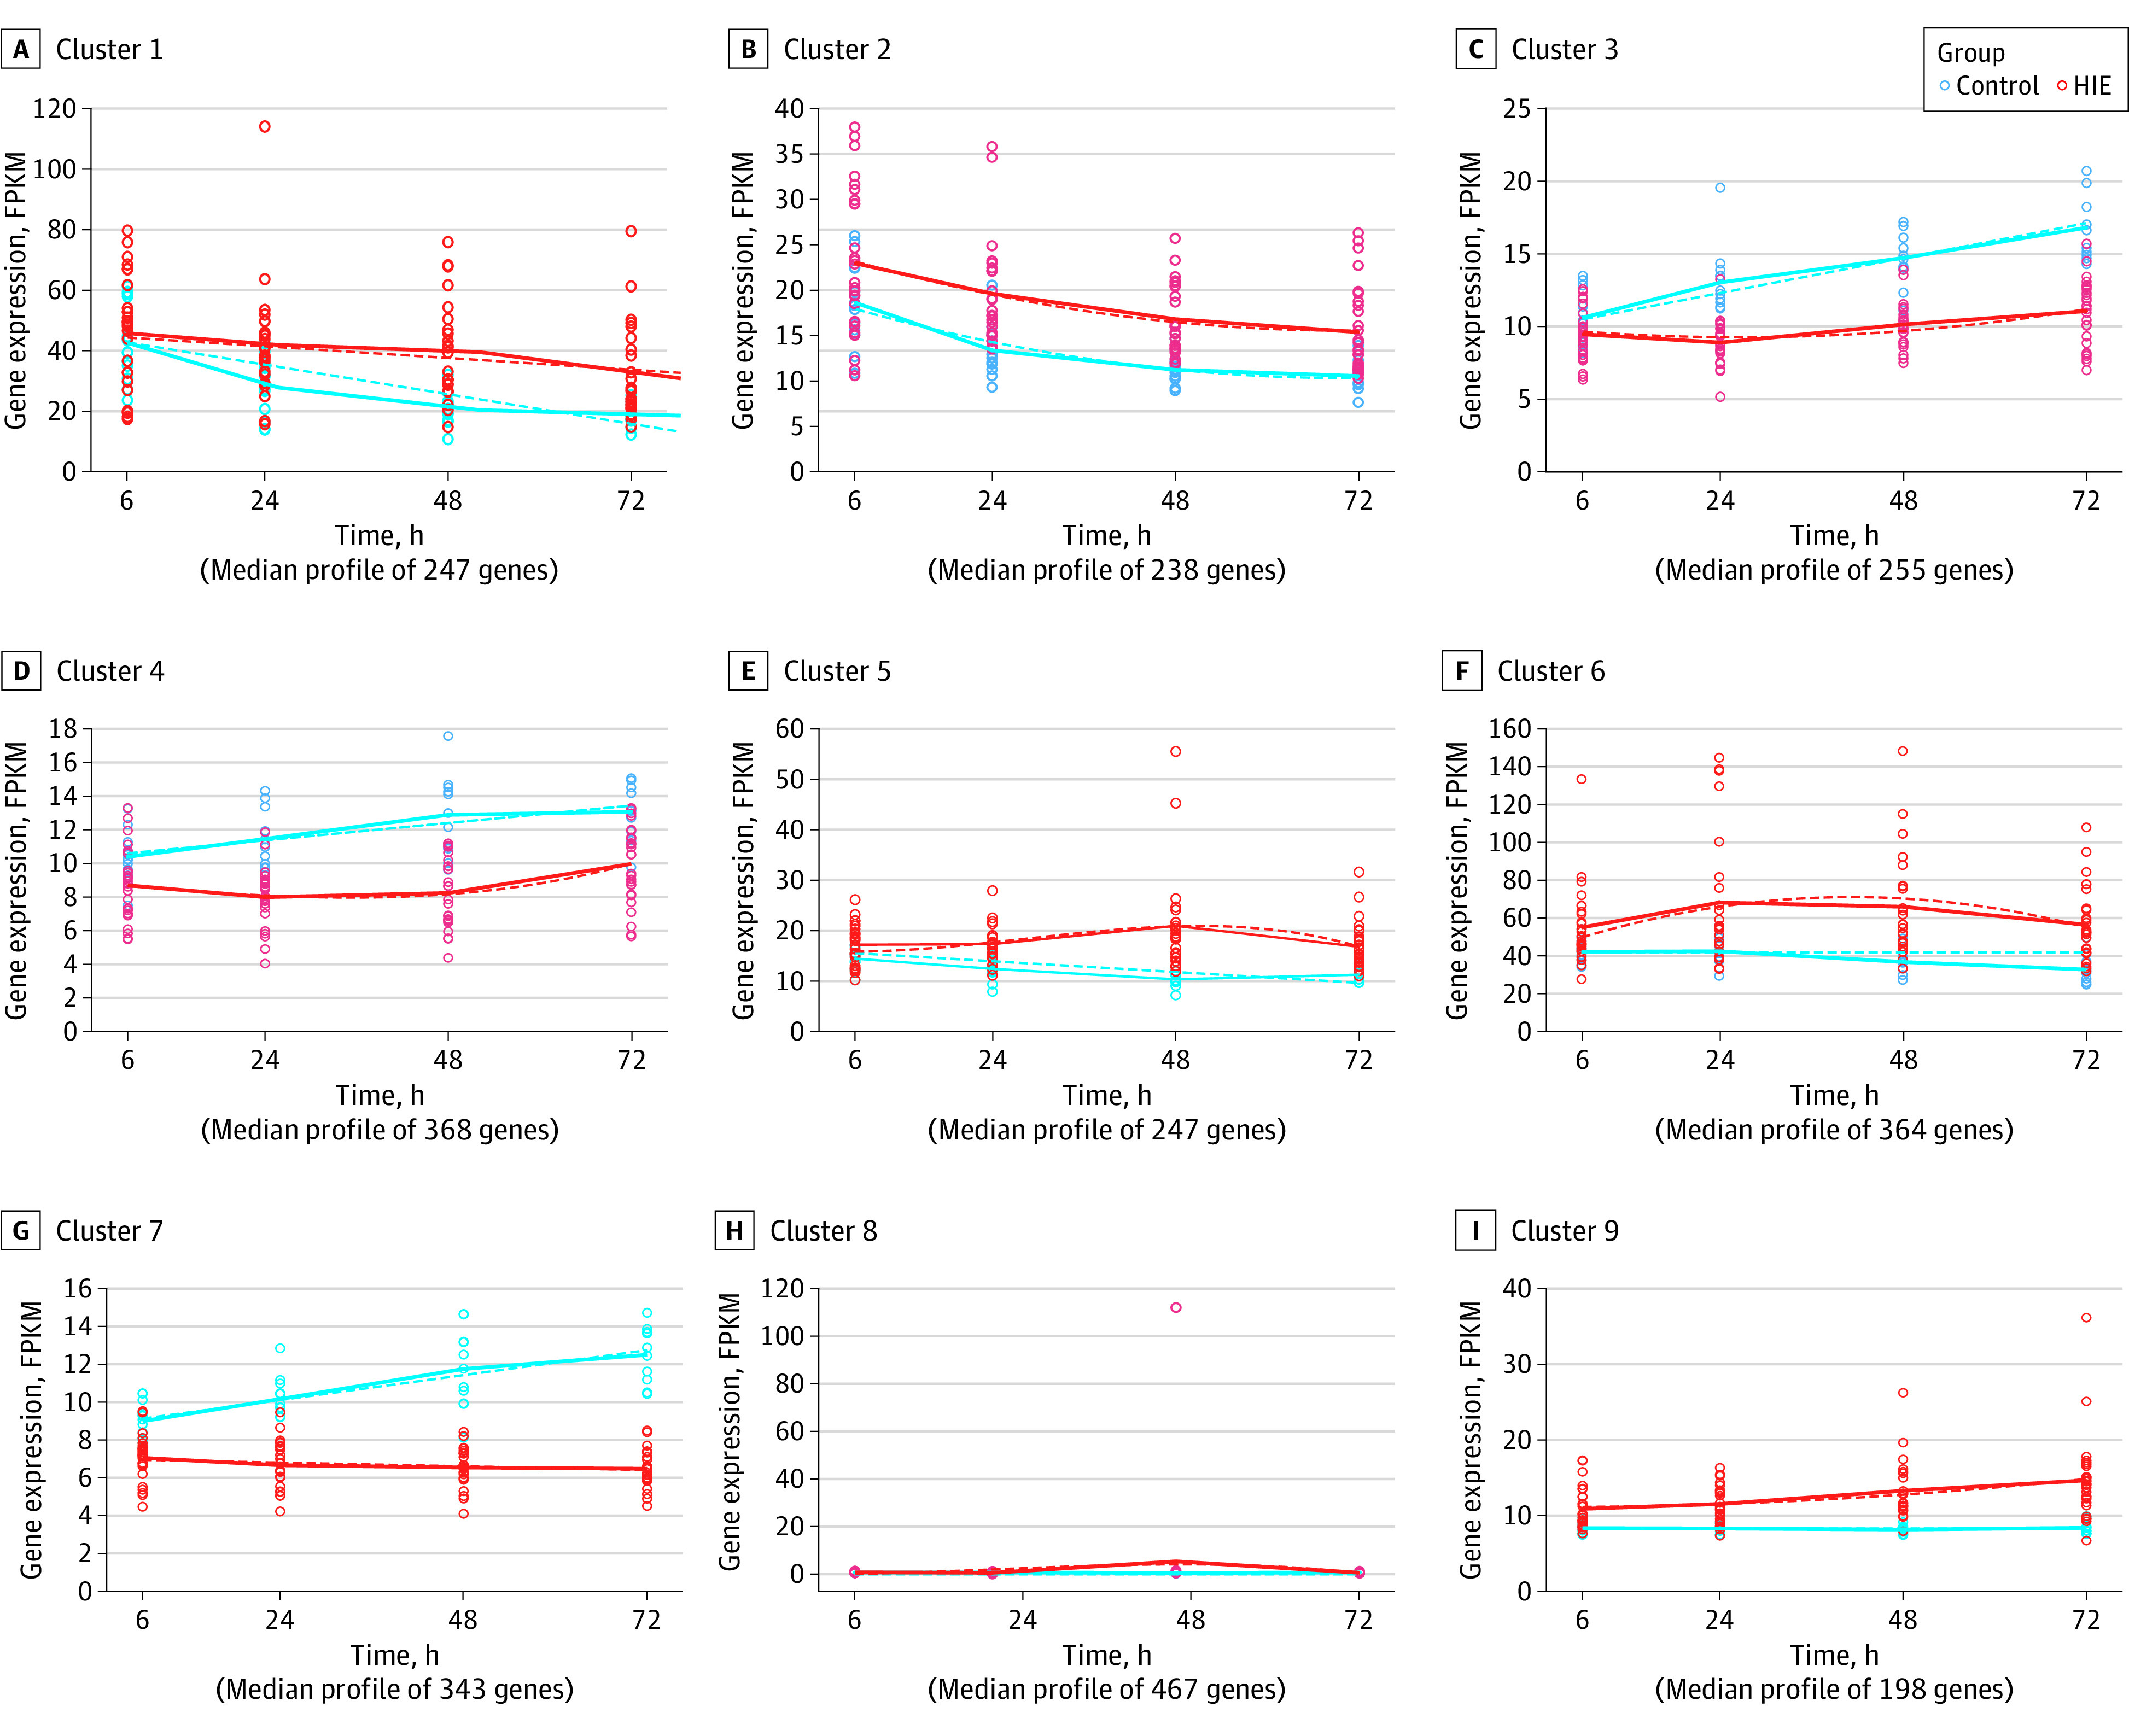
Figure 4. Temporal Evolution of Genome Expression of Neonates With Hypoxic-Ischemic Encephalopathy (HIE) vs Healthy Controls.

Solid lines represent the actual mean values of gene expression at each time point. Fitted curves are shown as dashed lines. FPKM indicates fragments per kilobase of transcript per million mapped reads.
