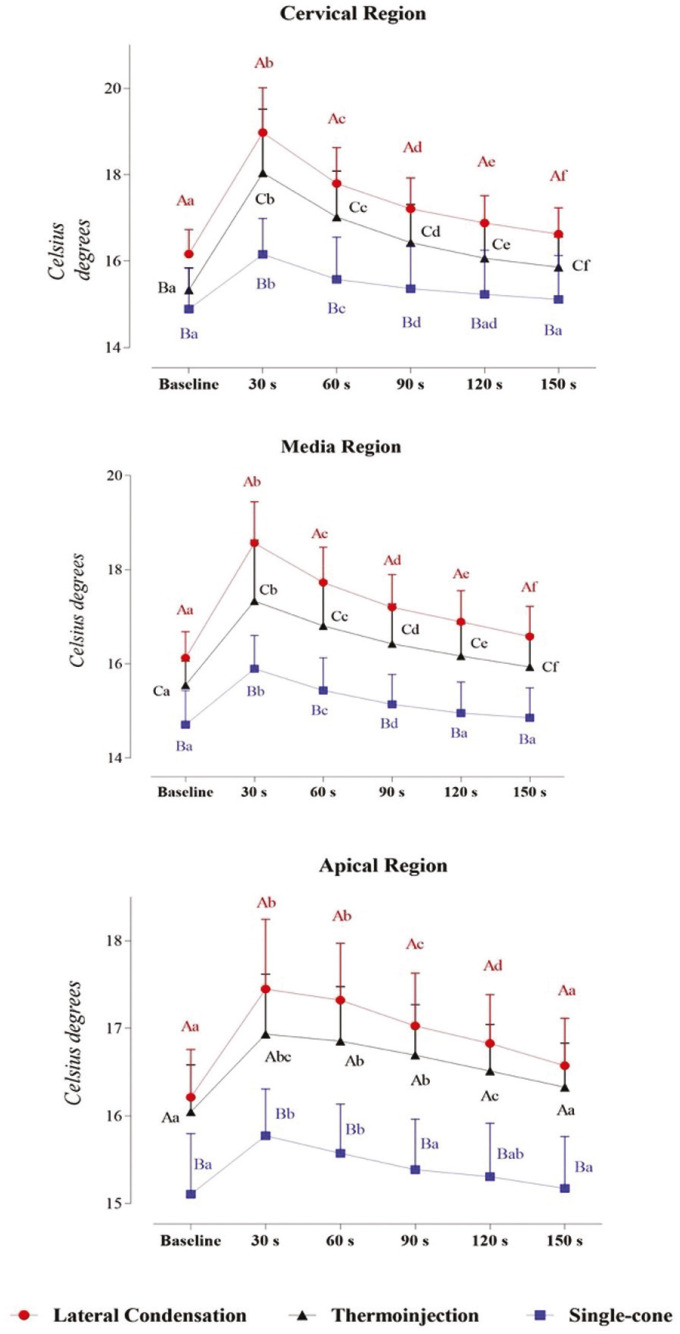
Figure 2.
Interaction between time, filling technique, and third in infrared thermographic analysis: a Three-way Mixed Model. Statistical analyses were performed with a sample of 45 cases, 15 per group. ηp2: Partial eta squared. Data plotted as mean and standard deviation. Table 2 provides complementary information regarding data statistics. To overcome sphericity violation, the Greenhouse-Geisser correction were applied. Main effects were suppressed due to significant interactions. Interaction effects for Time and Filling technique: α = 0.001, β-1 = 1.000, ηp2 = 0.174). Interaction effects for Time and Anatomic region: α = 0.000, β-1 = 1.000, ηp2 = 0.258.

