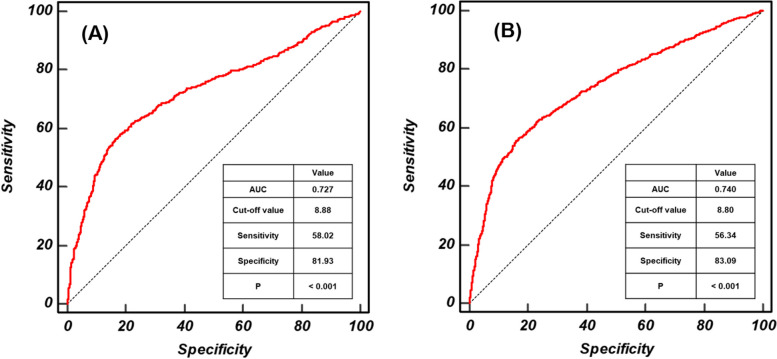
Fig. 3.
ROC curves for the TyG index in males and females with metabolic syndrome. The optimal cut-off values of the TyG index for the identification of MONW in males (A) and females (B) were derived from receiver operating characteristic (ROC) curves. Dotted line: reference; solid red line: AUC, indicating the accuracy of the TyG index for the identification of MS; cut-off value: the value of TyG index that predicts MS; sensitivity: the probability of individuals who had MS to be predicted to have MS; specificity: the probability of individuals who did not have MS to be predicted not to have MS. Abbreviations: AUC, area under the curve; MS, metabolic syndrome; TyG, triglyceride-glucose index

