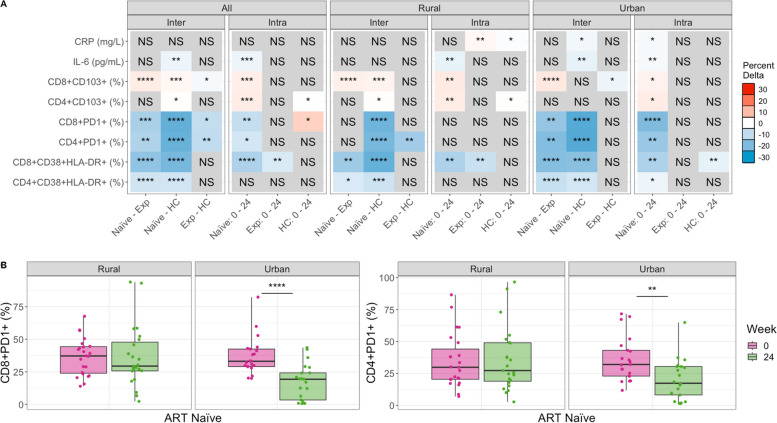
Fig. 1.
Differences in immune markers across cohorts and over time, before and after commencement of ART. Comparing immune marker values between cohorts (inter) and across timepoints (intra). Inter-cohort comparisons were performed on baseline (week 0) samples using a Kruskal–Wallis with a Dunn’s post hoc test. Intra-cohort comparisons compared week 0 to 24 using a paired Mann–Whitney U test. Significant relationships are colored by the mean change in value to show directionality: For any given comparison (e.g., naïve – Exp), the box is colored red (up) if the average value of Exp is higher than that of naïve. If blue (down), the average value of Exp is lower than naïve. The intensity of the color indicates the strength of the change. Detailed plots for significant relationships are shown in Figure S3 (CD8 + CD38 + HLA-DR + and CD4 + CD38 + HLA-DR +), Figure S4 (CD4 + PD1 + and CD8 + PD1 +), Figure S5 (IL-6 and CRP), and Figure S6 (CD8 + CD103 + and CD4 + CD103 +). B Stratified analysis of CD8 and CD4 PD1 percent change over time by location. p-values are coded as “****” between (0, 0.0001), “***” (0.0001, 0.001), “**” (0.001, 0.01), and “*” (0.01, 0.05), with square brackets indicating that the endpoints are included in the interval. NS not significant, Naïve ART-naïve cohort, Exp ART-experienced cohort

