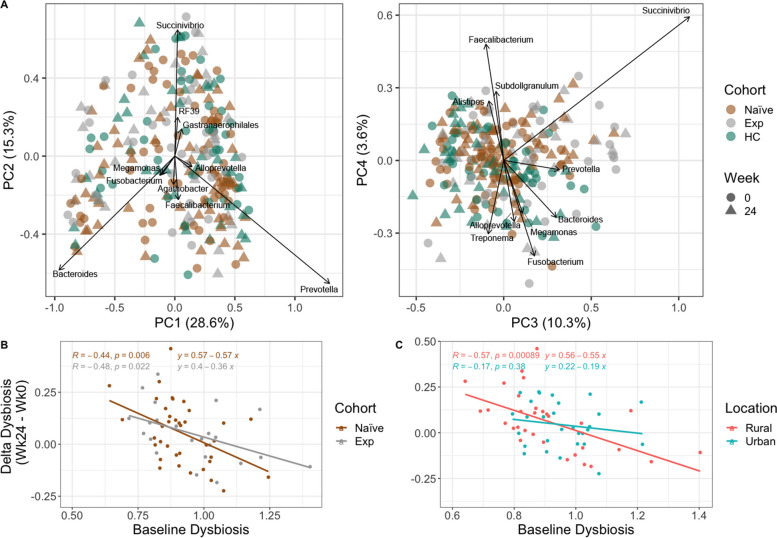
Fig. 3.
Biplots of weighted UniFrac PCoA axes and delta dysbiosis analyses stratified by cohort and location. A Plotted weighted UniFrac PCoA axes that account for over 50% of the variance with important genera (importance defined as those farthest from the origin using Euclidean distance) indicated. B Linear regression model showing delta dysbiosis as a function of baseline dysbiosis stratified by cohort. Dysbiosis for each sample in ART-naïve and experienced cohorts was calculated by taking the average weighted UniFrac distance from each sample to all healthy controls (HC). This average was calculated on values of the same timepoint. For example, if the sample had been taken at week 0, the dysbiosis score (average distance to HC) was calculated with values only at week 0. Delta dysbiosis was calculated by taking the difference in dysbiosis between week 24 and 0. C Same analysis as B but stratified by location

