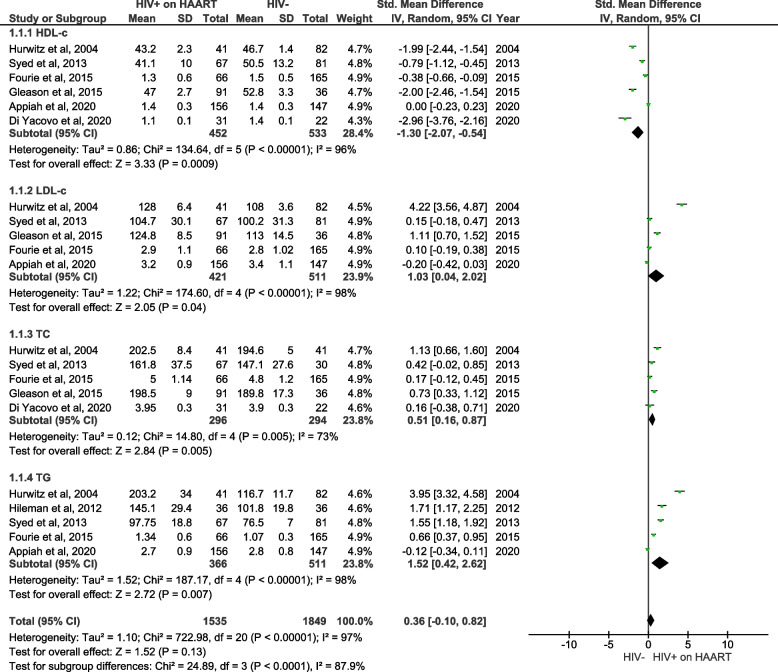
Fig. 6.
A forest plot showing outcomes of a meta-analysis for lipid profiles, including high density lipoprotein-cholesterol (HDL-c), low density lipoprotein-cholesterol (LDL-c), total cholesterol (TC) and triglycerides (TG), in people living with the human immunodeficiency virus (PLWH) on highly active antiretroviral therapy (HAART) in comparison to HIV-negative controls. Green squares represent the weight of each study in the average effect size. Horizontal lines across red squares represent the 95% confidence intervals for the point estimate. The diamonds represent the weighted average point estimate

