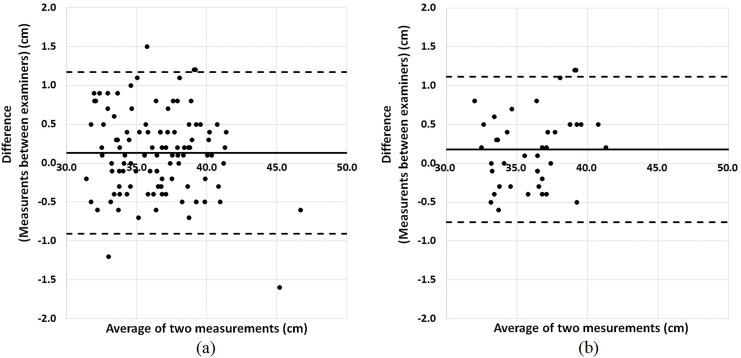
Figure 2. Bland-Altman plots for the inter-rater reliability of neck circumference measurement.
Bland-Altman plots are shown for (A) all participants (bias: 0.1, 95% LOA: −0.9 to 1.2) and (B) the edematous group (bias: 0.2, 95% LOA: −0.8 to 1.1). Bias reflects the mean value of the difference between examiners, and the 95% LOA (limit of agreement) was calculated as follows: bias ± 1.96 × (standard deviation of the difference between examiners). The middle line denotes the bias and dashed lines denote the 95% LOA.

