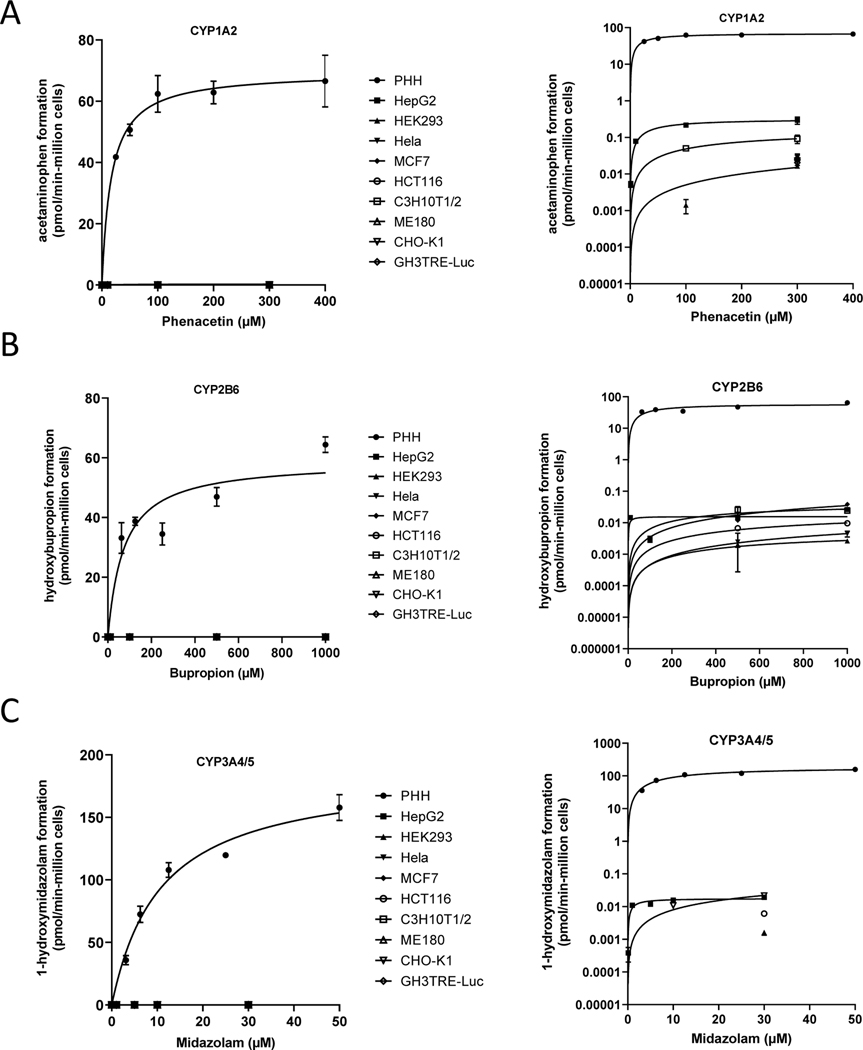
Figure 1. Metabolism comparison between PHHs and Tox21 cell lines.
Fifty-donor pool of PHHs and Tox21 cell lines at ~50,000 cells/well were treated with probe substrates phenacetin (PHH = 25, 50, 100, 200, 400, Tox21 = 0.1, 1, 10, 100, 300) bupropion (PHH = 62.5, 125, 250, 500, 1000, Tox21 = 1, 10, 100, 500, 1000), and midazolam (PHH = 3.125, 6.25, 12.5, 25, 50, Tox21 = 0.1, 1, 5, 10, 30). LC-MS assays were performed to quantify acetaminophen (A: CYP1A2), hydroxybupropion (B: CYP2B6), and 1-hydroxymidazolam (C: CYP3A4/5/7) plotted on both linear (left) and log (right) scales. Metabolite concentrations were converted to pmol of total metabolite per million cells plated over the respective incubation periods used for each model (pmol/min-106 cells).

