Figure 1.

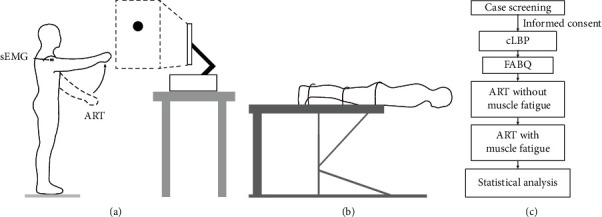
Experimental paradigm and the test flowchart. (a) Schematic diagram of the arm-raising task (ART) with visual cues was illustrated. (b) Schematic diagram of the Biering–Sorenson test (BST). (c) The flowchart of the study.

Experimental paradigm and the test flowchart. (a) Schematic diagram of the arm-raising task (ART) with visual cues was illustrated. (b) Schematic diagram of the Biering–Sorenson test (BST). (c) The flowchart of the study.