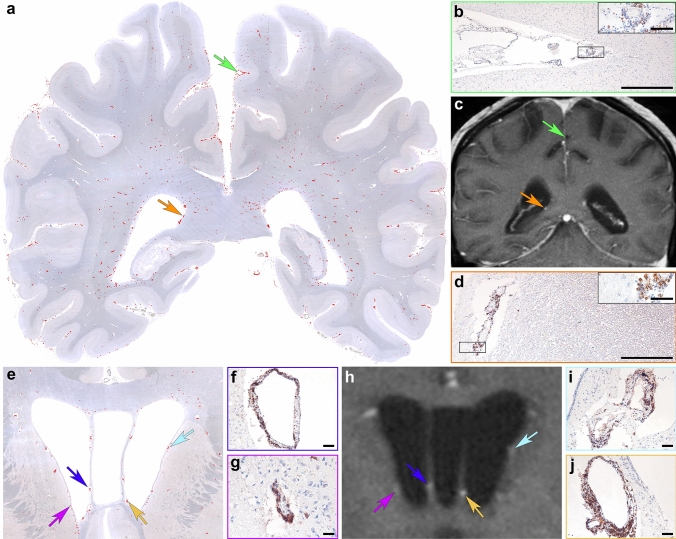
Fig. 2.
Topographical mapping and imaging characteristics of inflammatory infiltrates of autopsy case #1 Topographical evaluation of a double-hemispheric brain section shows a widespread distribution of CD20+ B cells (a; red dots represent immunolabeled cells) in the meninges (a, green arrow enlarged in panel b), in perivascular cuffs (a, orange arrow enlarged in panel d) and in the brain parenchyma. Corresponding in vivo brain MRI shows multiple areas of gadolinium enhancement in post-contrast T1 images (c, green arrow indicates meningeal inflammation, orange arrow indicates the corresponding place where abundant number of B lymphocytes were present around blood vessels). Anatomic distribution of inflammation in a more anterior brain section including the basal ganglia similarly shows a maximum of CD20+ B cells mainly around the ventricles (e; red dots represent immunolabeled cells). Colored arrows in e and h (enlarged in f, g, i, j) indicate a profound number of perivascular CD20+ B cells that are visible as gadolinium enhancement in the corresponding in vivo MR image (h). Scale bars b, d 500 µm; inset in b and d 50 µm; f, g, i, j 25 µm

