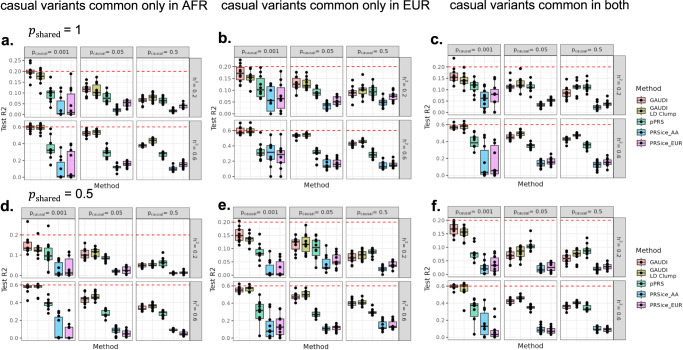
Fig. 2. GAUDI performance compared to PRSice and pPRS in large EUR simulation studies under different settings.
a–c (proportion of variants with shared effects across ancestry groups) = 1: no ancestry-differential effects for all causal variants. d–f = 0.5: half of the causal variants have ancestry-differential effects. a, d Causal variants are common only in AFR ancestry, specifically EUR-MAF < 5% and AFR-MAF > = 5%. b, e Causal variants are common only in EUR ancestry, i.e., EUR-MAF > = 5% and AFR-MAF < 5%. c, f Causal variants are common in both ancestries, i.e., EUR-MAF and AFR-MAF both >= 5%. Each experiment was repeated 10 times (shown in the box plots). The minima, maxima and center represent the minimum, maximum and median test R2 across the 10 repeats. The bounds of the boxes represent upper and lower quartiles, with whiskers represent 1.5 times of the interquartile range. The maximum LD R2 between causal variants were set to be 0.2 for all settings. The dashed red line denotes heritability. : proportion of causal variants out of all variants. Source data are provided as a Source Data file.

