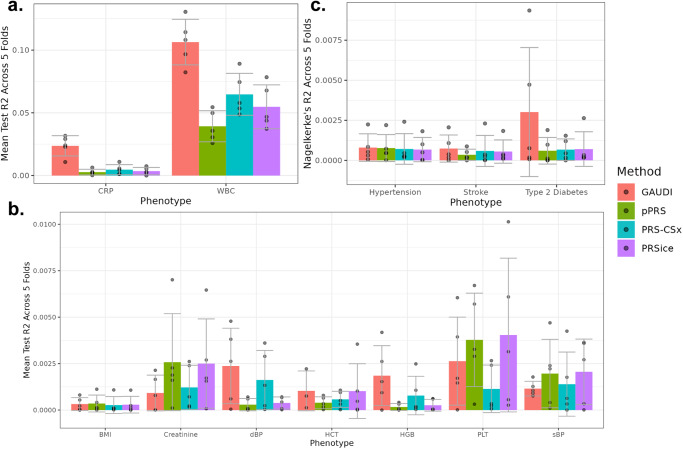
Fig. 3. GAUDI performance compared to pPRS, PRS-CSx and PRSice in WHI AA internal evaluations for different traits.
a CRP and WBC; b other continuous traits; c binary diseases. Each analysis was repeated five times, using five different WHI AA training and testing sets. The center of each bar plot represents the mean R2 across five folds, with the error bar denoting the standard deviation across the five replicates. CRP C-reactive protein, WBC White blood cell count, BMI Body mass index, dBP Diastolic blood pressure, HCT Hematocrit, HGB Hemoglobin, PLT Platelet count, sBP Systolic blood pressure. Source data are provided as a Source Data file.

