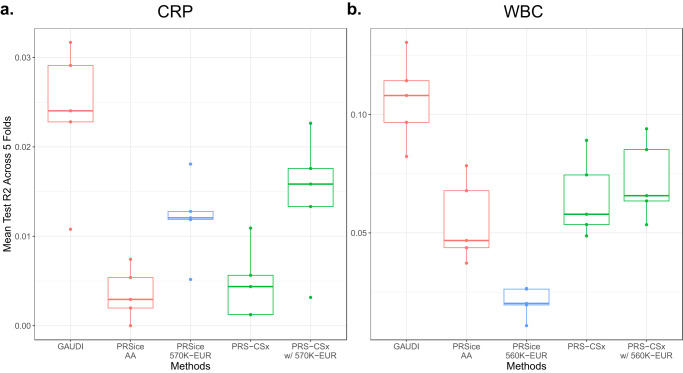
Fig. 4. Performance comparison with PRS-CSx and PRSice utilizing large external EUR-based GWAS summary statistics.
a CRP; b WBC. We compared GAUDI trained on ~5500 WHI AA individuals, with (1) PRSice using GWAS from the same ~5500 WHI AA training individuals; (2) PRSice using large external EUR-based GWAS (N > 560 K); (3) PRS-CSx using GWAS from both the same ~5500 WHI AA training individuals and WHI WHIMS + EUR-based GWAS (N = 5681); (4) PRS-CSx using GWAS from both the same ~5500 WHI AA training individuals and large external EUR-based GWAS (N > 560 K). Each analysis was repeated five times (shown in the box plots), using five different WHI AA training and testing sets. The minima, maxima and center represent the minimum, maximum and median test R2 across the 5 folds. The bounds of the boxes represent upper and lower quartiles, with whiskers represent 1.5 times of the interquartile range. The red color indicates methods that only used AA-based information; the blue color indicates methods that only used EUR-based information; and the green color indicates methods that used both AA- and EUR- based information. Source data are provided as a Source Data file.

