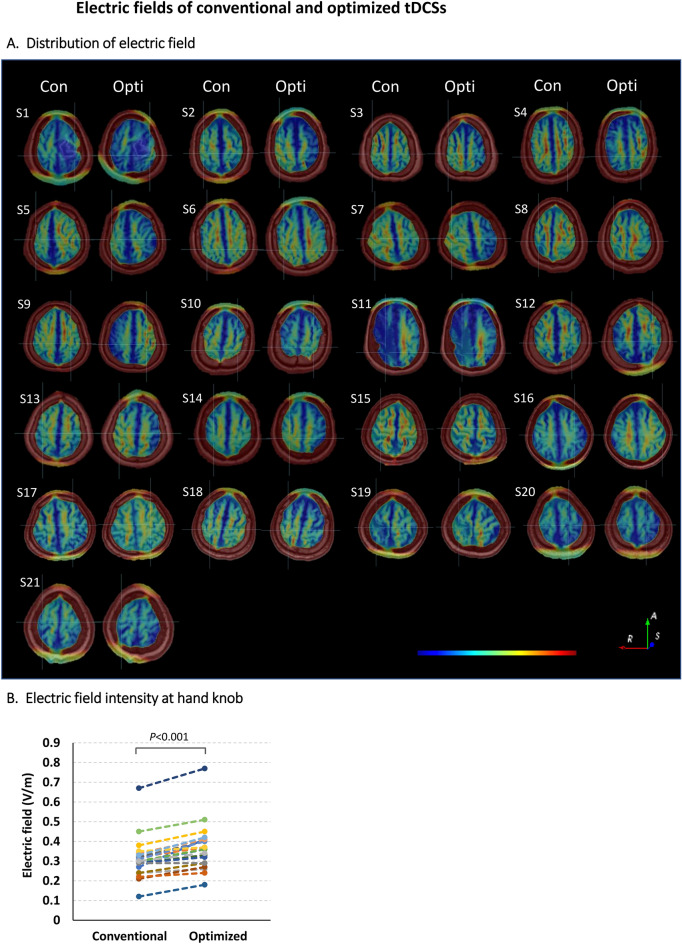
Figure 2.
The electric fields of conventional and optimized tDCSs. (A) Electric field distributions at the target areas (the hand knobs) of conventional tDCS (left) and optimized tDCS (right) in 21 stroke patients. The centers of the intersecting lines correspond to the target areas. The magnitude of the electric field increases linearly from blue to red. Notation: Con, Conventional tDCS simulation; Opti, Optimized tDCS simulation; R—Right; A—Anterior; S—Superior. (B) The electric field intensities in the target regions of conventional and optimized tDCS simulations. Circles represent individual patient data.

